


Bullion Brilliance
A Data- Driven Analysis of Gold's Behavior Following All-Time Highs


Introduction
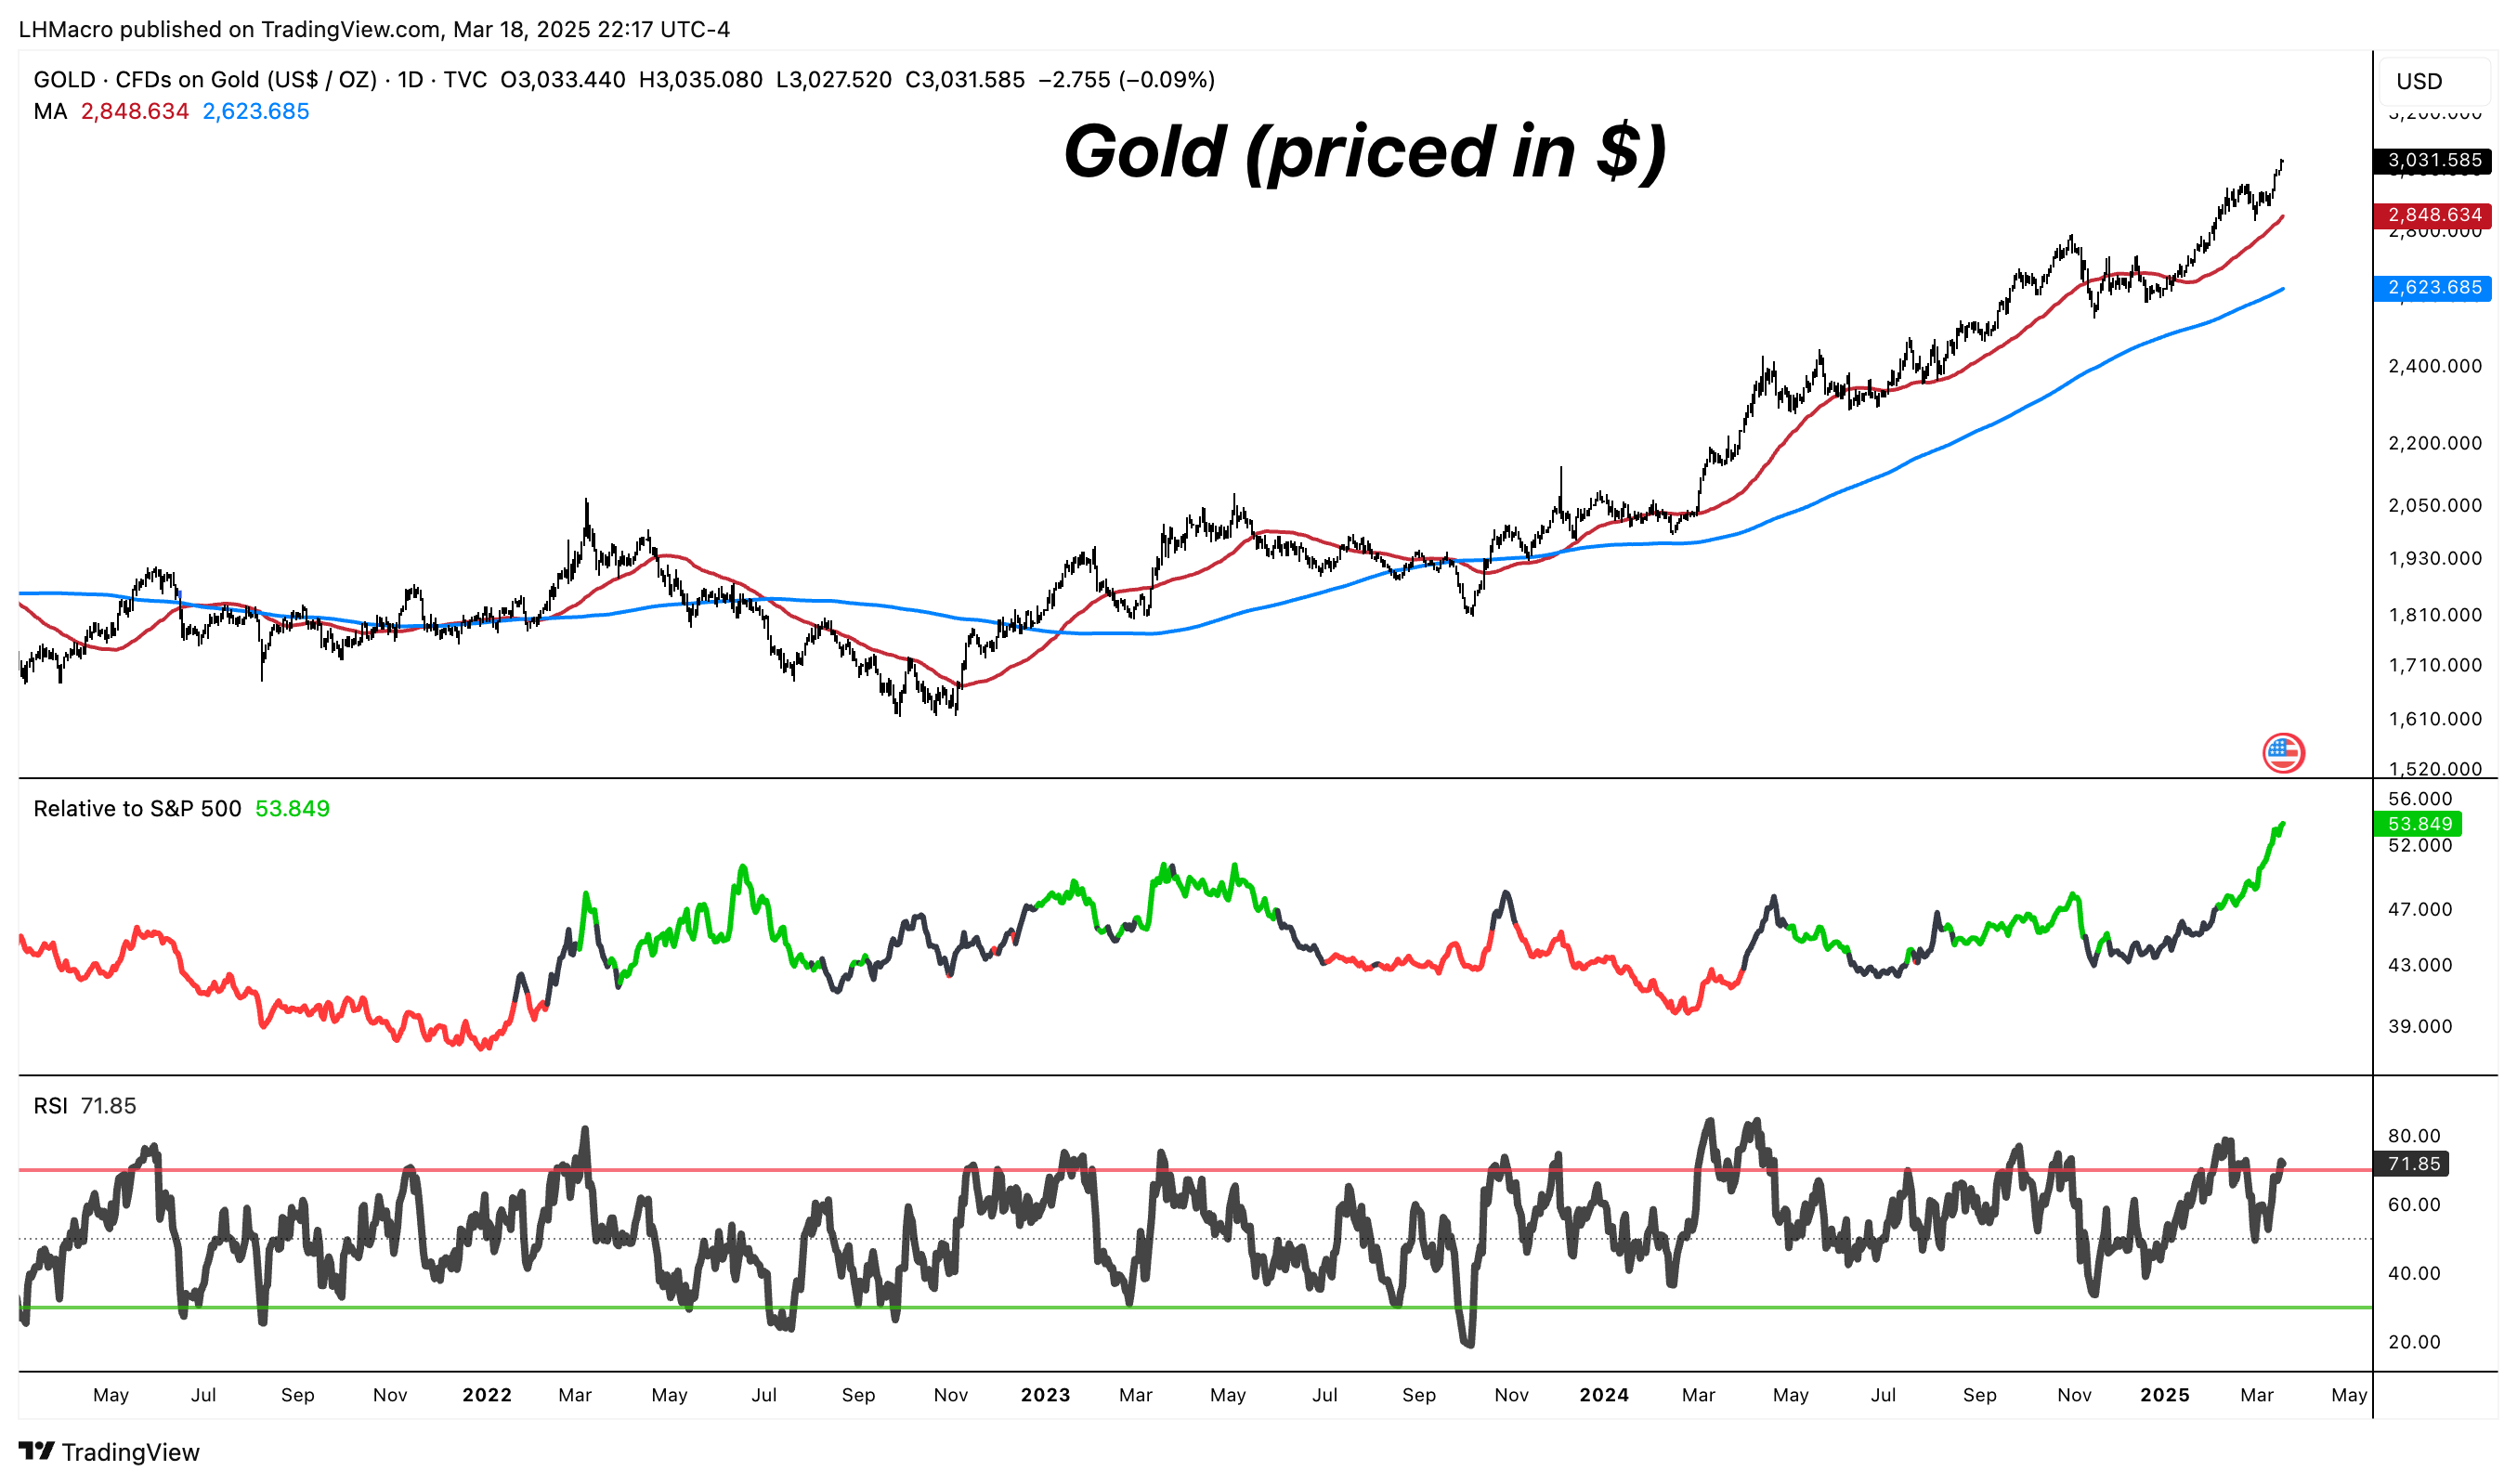
The nuanced global picture is a testament to investors’ trust in gold, which gains appeal during broad political and economic uncertainty. Despite the fact that it doesn’t generate yield or pay dividends, gold has outperformed stocks and crypto by a wide margin over the past twelve months. Prices have surged over 40 percent since the beginning of 2024 to thru yesterday’s close at yet another all-time high, settling above $3000/oz.
The yellow metal has long been considered a safe haven asset, and has handily outperformed stocks to start the year. Given the outperformance, some investors may be wary of buying after such a run, so we asked: how does Gold perform after reaching new all-time highs? Conventional wisdom might suggest that buying at peak prices is risky, but our analysis reveals a different story for gold. In this report, we examine gold's historical performance following new ATHs to provide investors with data-driven insights.
The Yearly Pattern of Gold ATHs
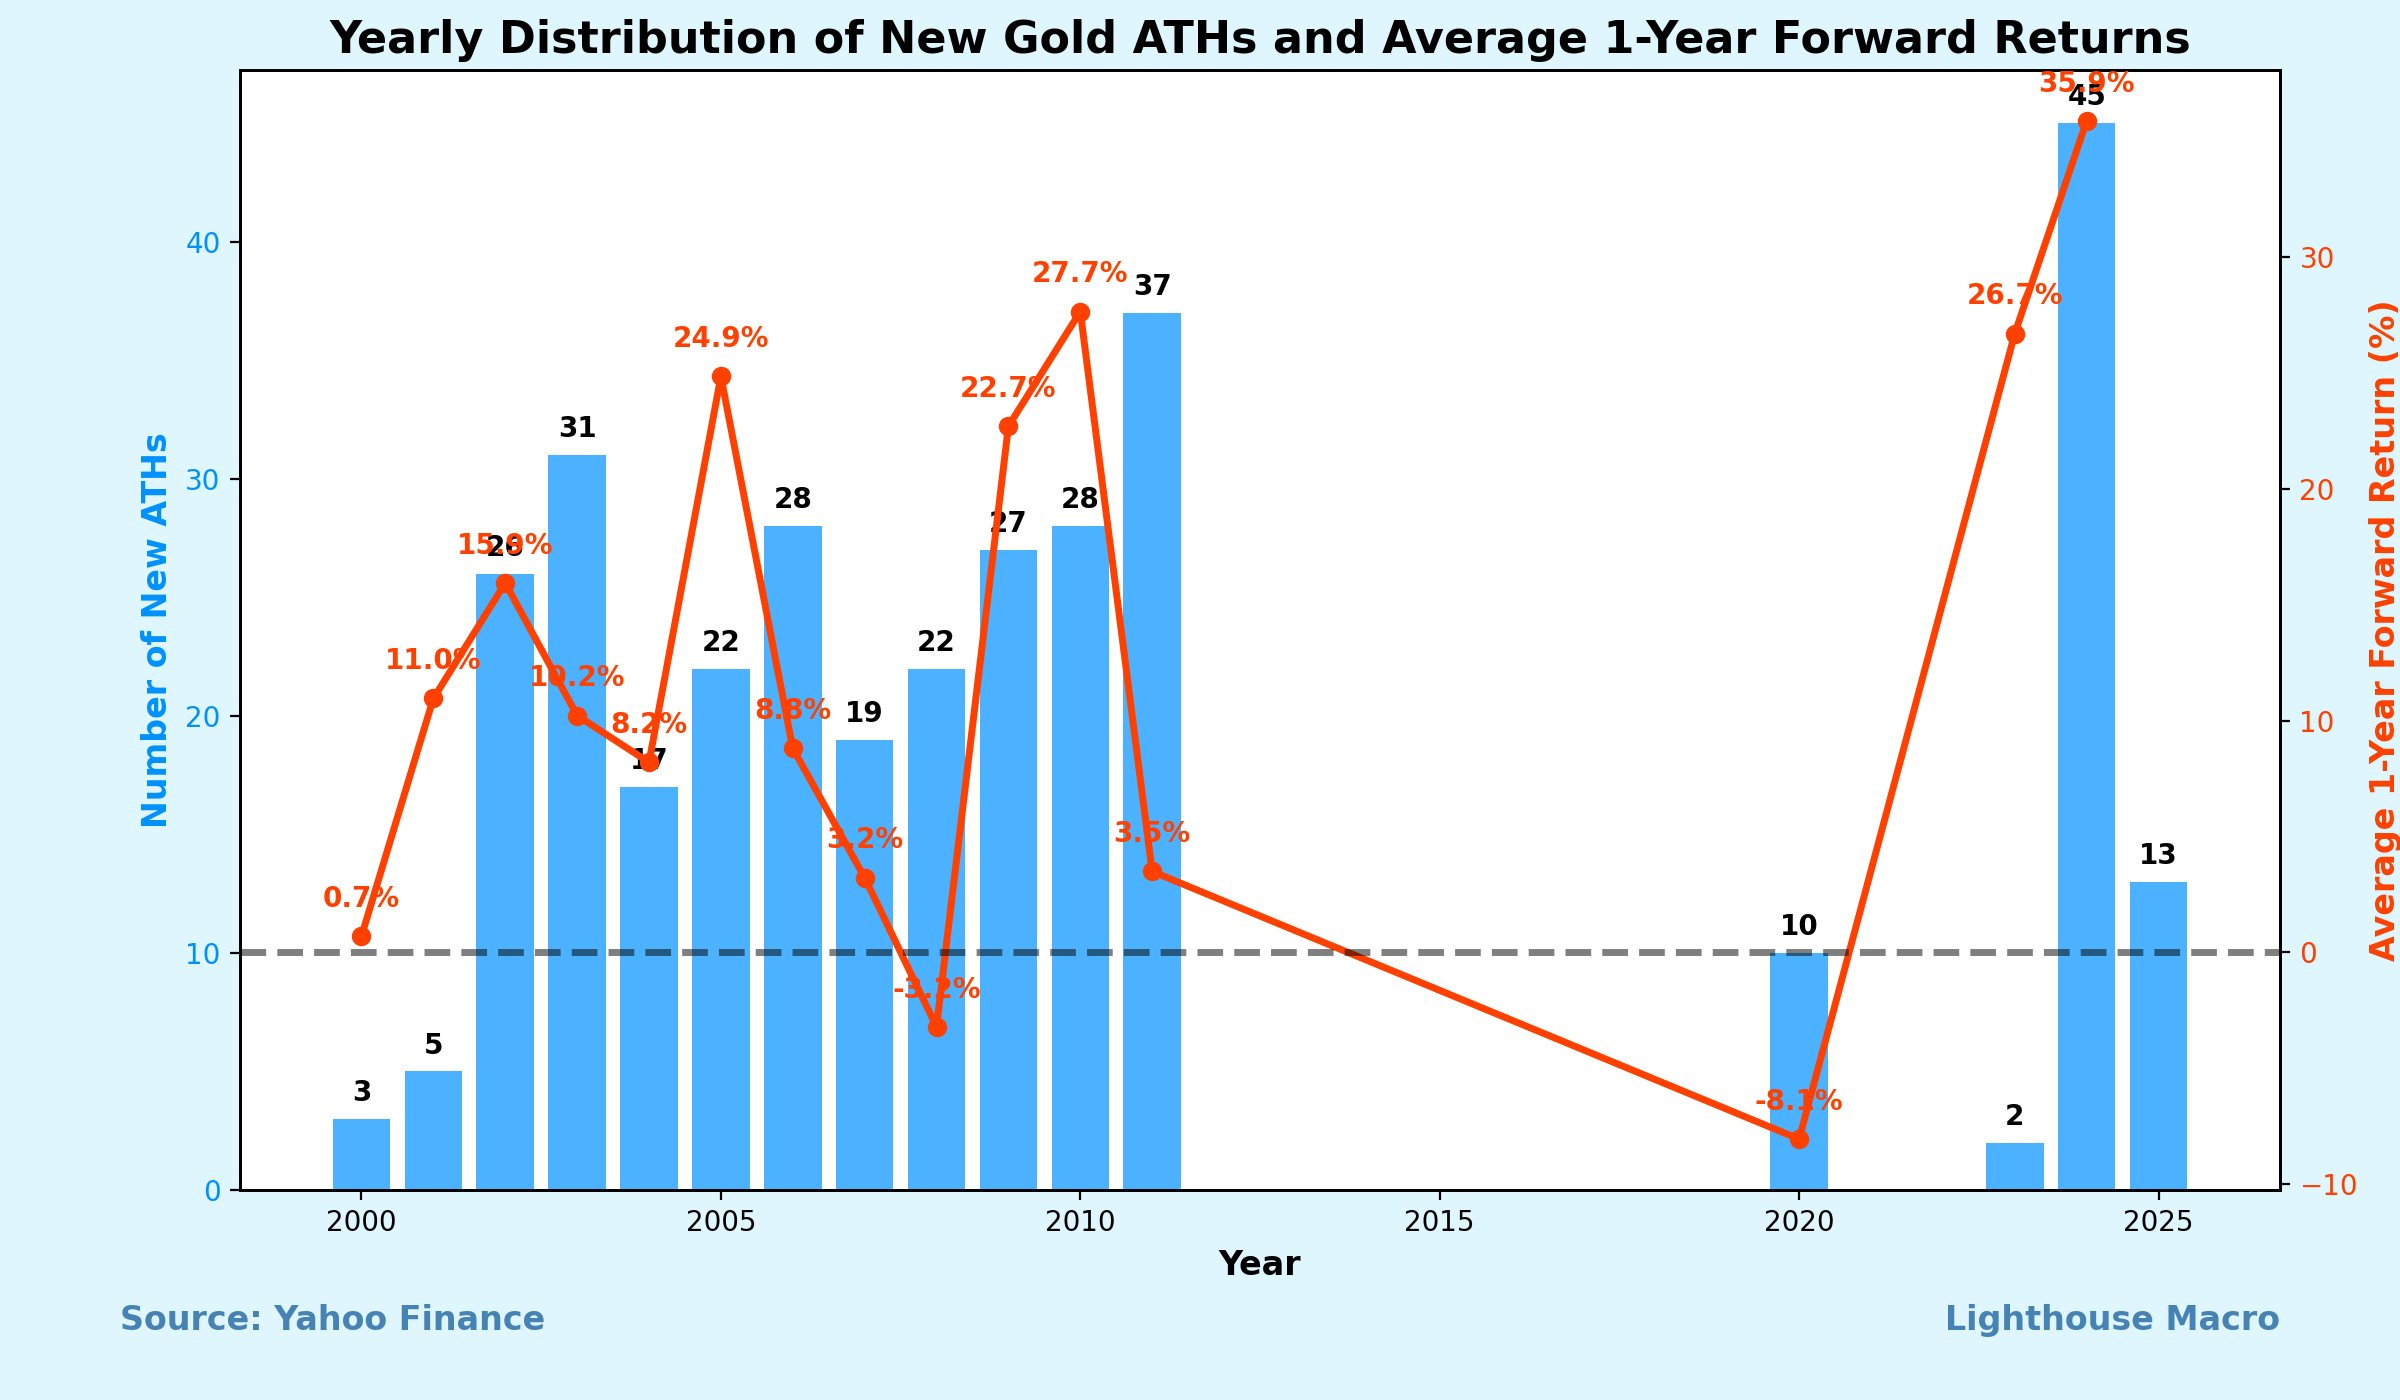
Looking at the yearly distribution of gold ATHs, we observe distinct clustering patterns. Years like 2002-2003, 2005-2011, and most recently 2024 have seen significant numbers of new highs. Interestingly, years with more ATHs often correlate with stronger forward returns, challenging the notion that new highs signal a top.
The data reveals that 2024 has already recorded the highest number of ATHs in a single year, with 45 new records. In less than three months into 2025, we’ve already had 13. This unprecedented frequency of new highs suggests strong momentum in the gold market.
Rolling 12-Month Analysis
The 12-month rolling count of new gold ATHs provides a dynamic view of gold's momentum. Periods with clusters of ATHs have historically preceded strong forward returns, with some exceptions during market disruptions.
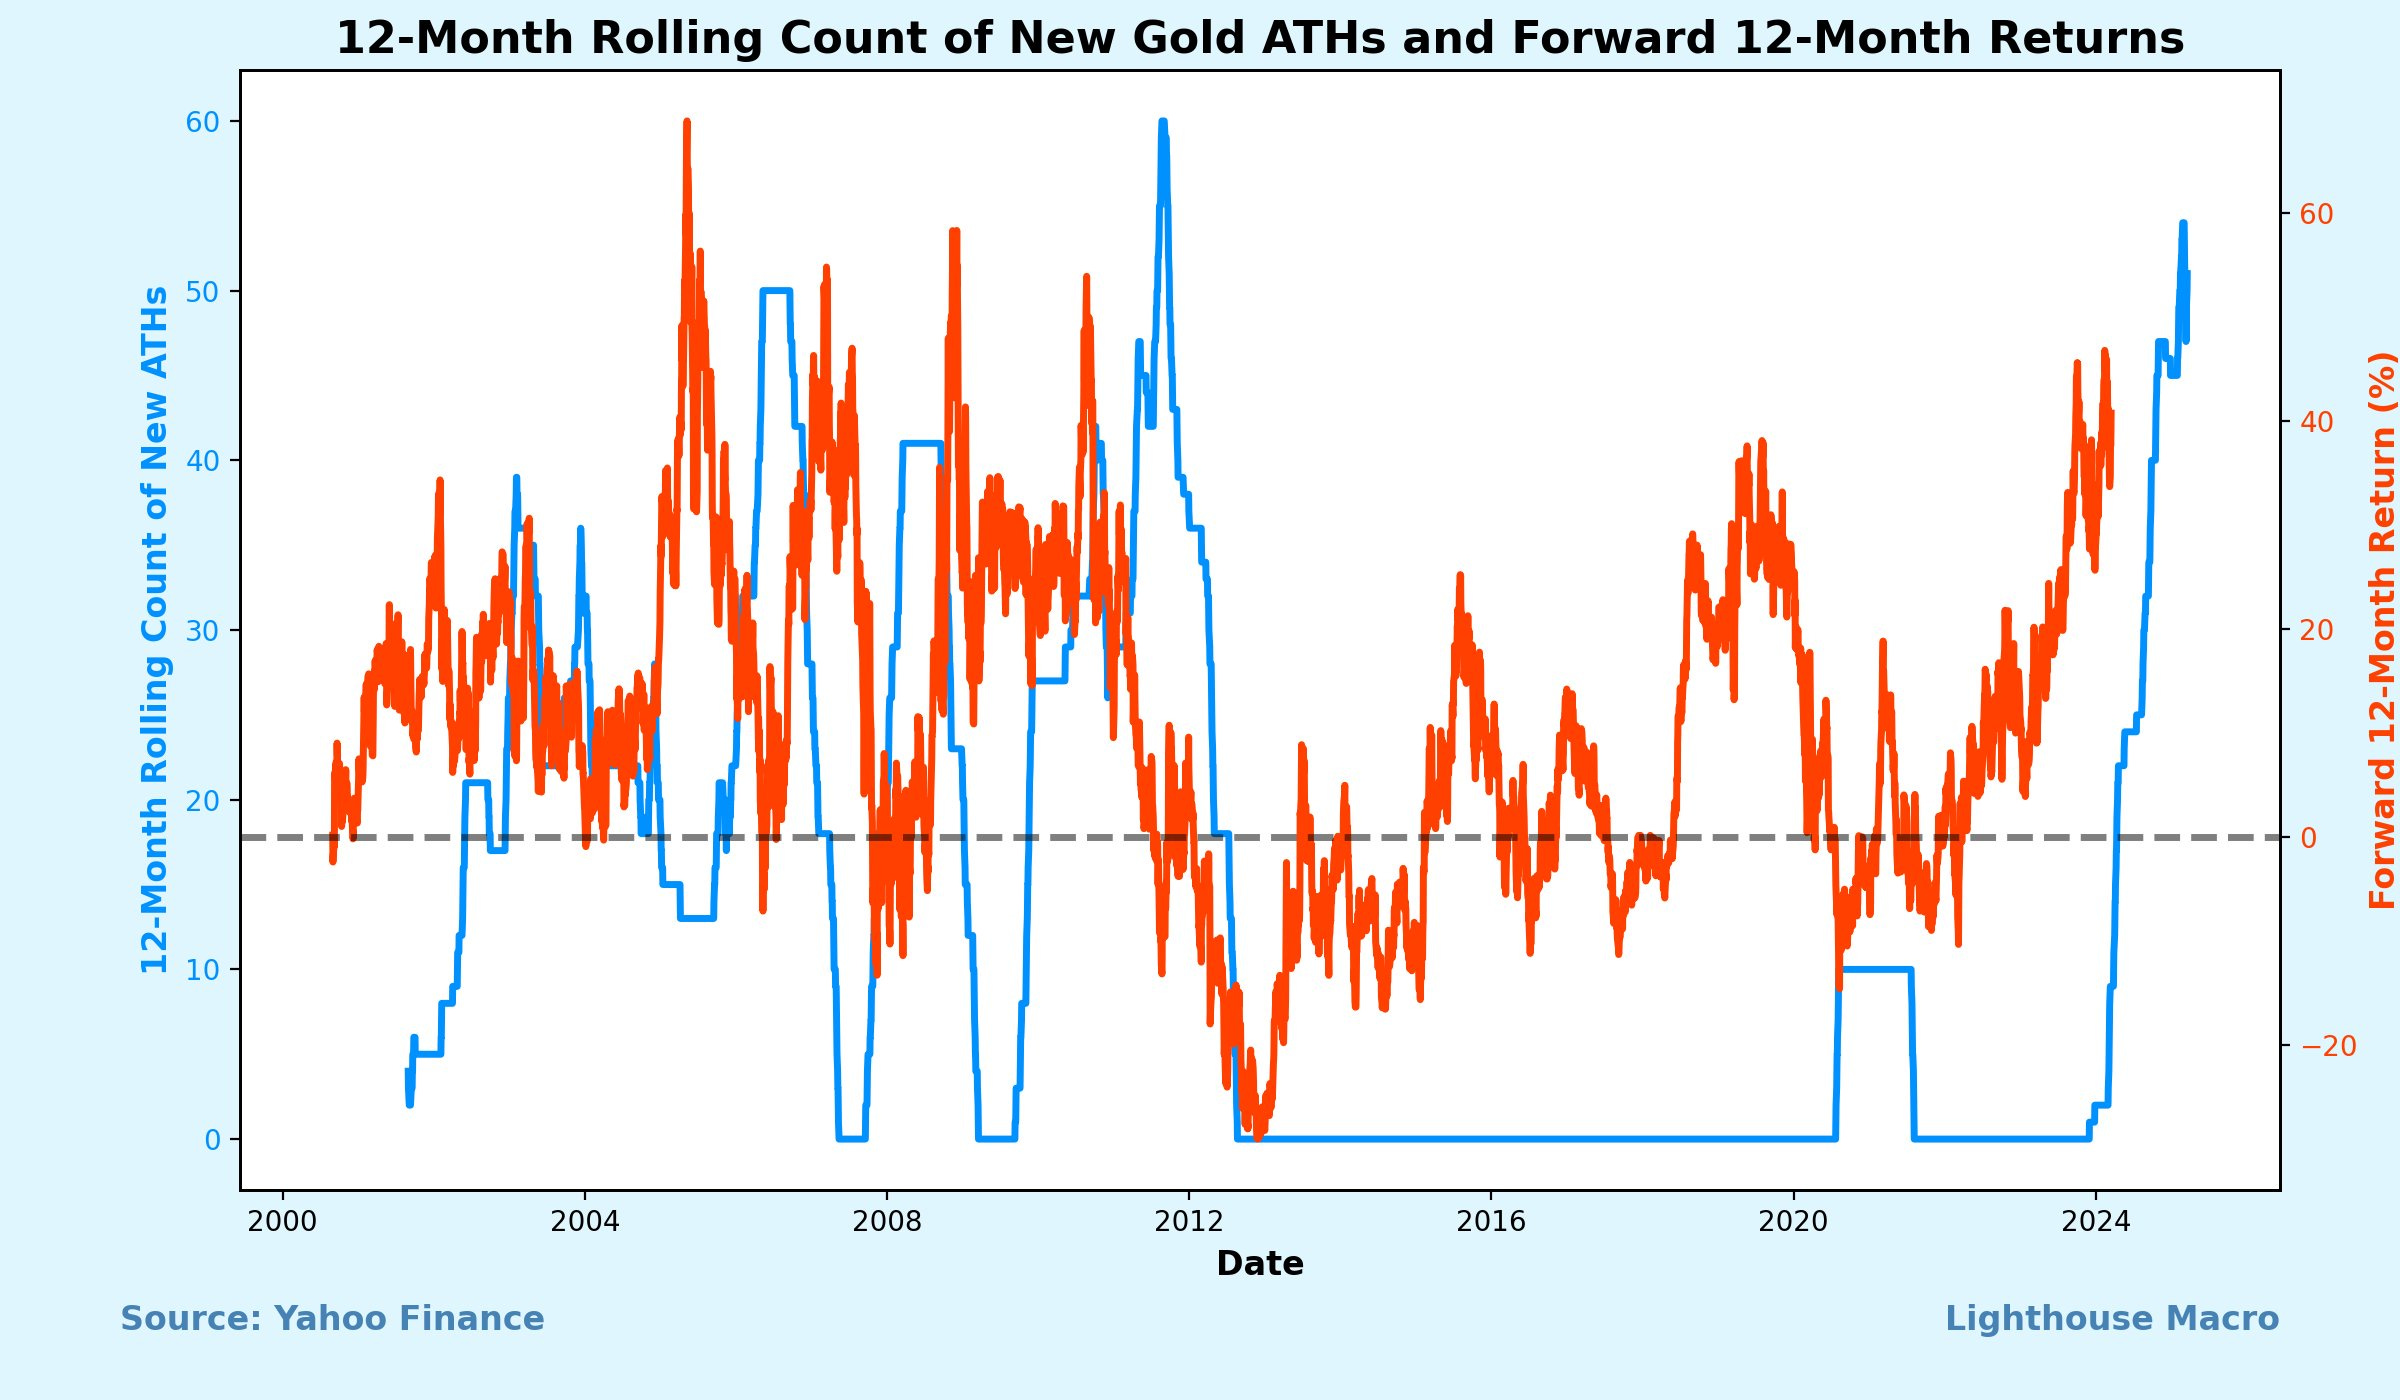
Notable periods of ATH clustering occurred in 2002-2003, 2006, 2009-2011, and now in 2023-2024. The current surge in new highs is particularly remarkable for its intensity.
Return Distribution After ATHs
Perhaps most compelling is the percentile distribution of gold returns following new ATHs. Across various time horizons from 1 day to 1 year, gold has shown increasingly positive returns as the holding period extends.
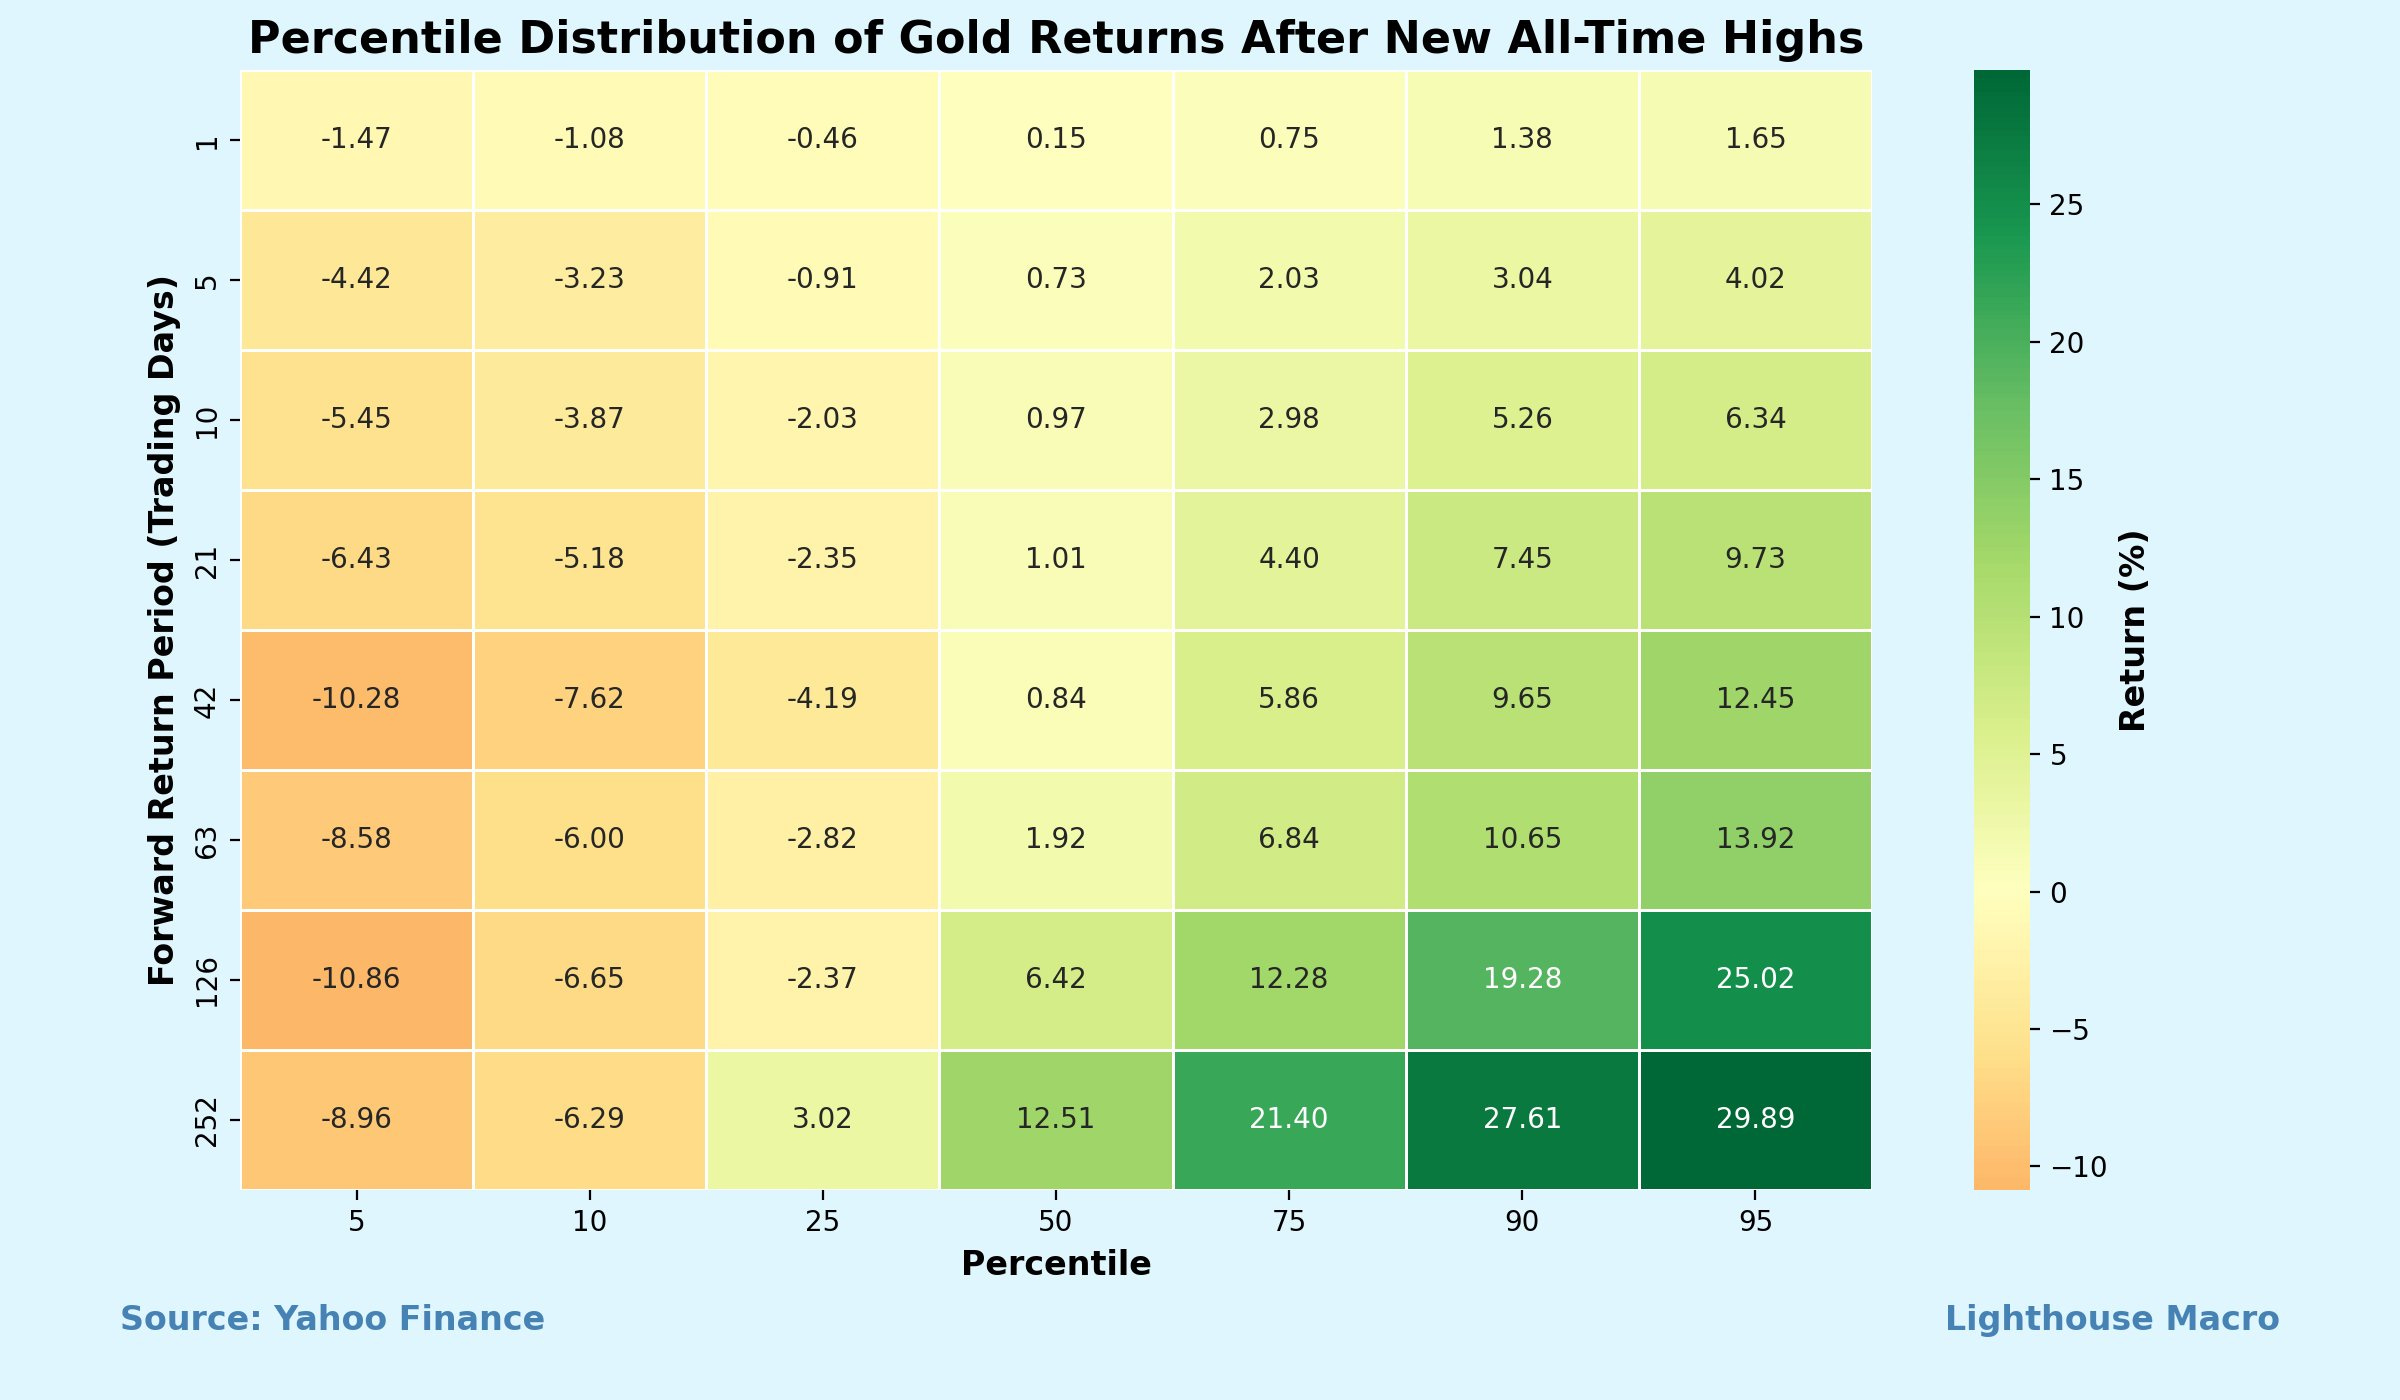
Key insights from this analysis:
Short-term returns (1-5 days) show modest positive skew
Medium-term returns (1-3 months) demonstrate increasing reliability
Long-term returns (6-12 months) reveal strong positive performance
The data shows that 12-month returns following ATHs have been positive nearly 80% of the time, with median returns exceeding 12%.
Comprehensive Statistics
Our statistical analysis reveals that gold's performance after making new ATHs improves significantly with longer time horizons:
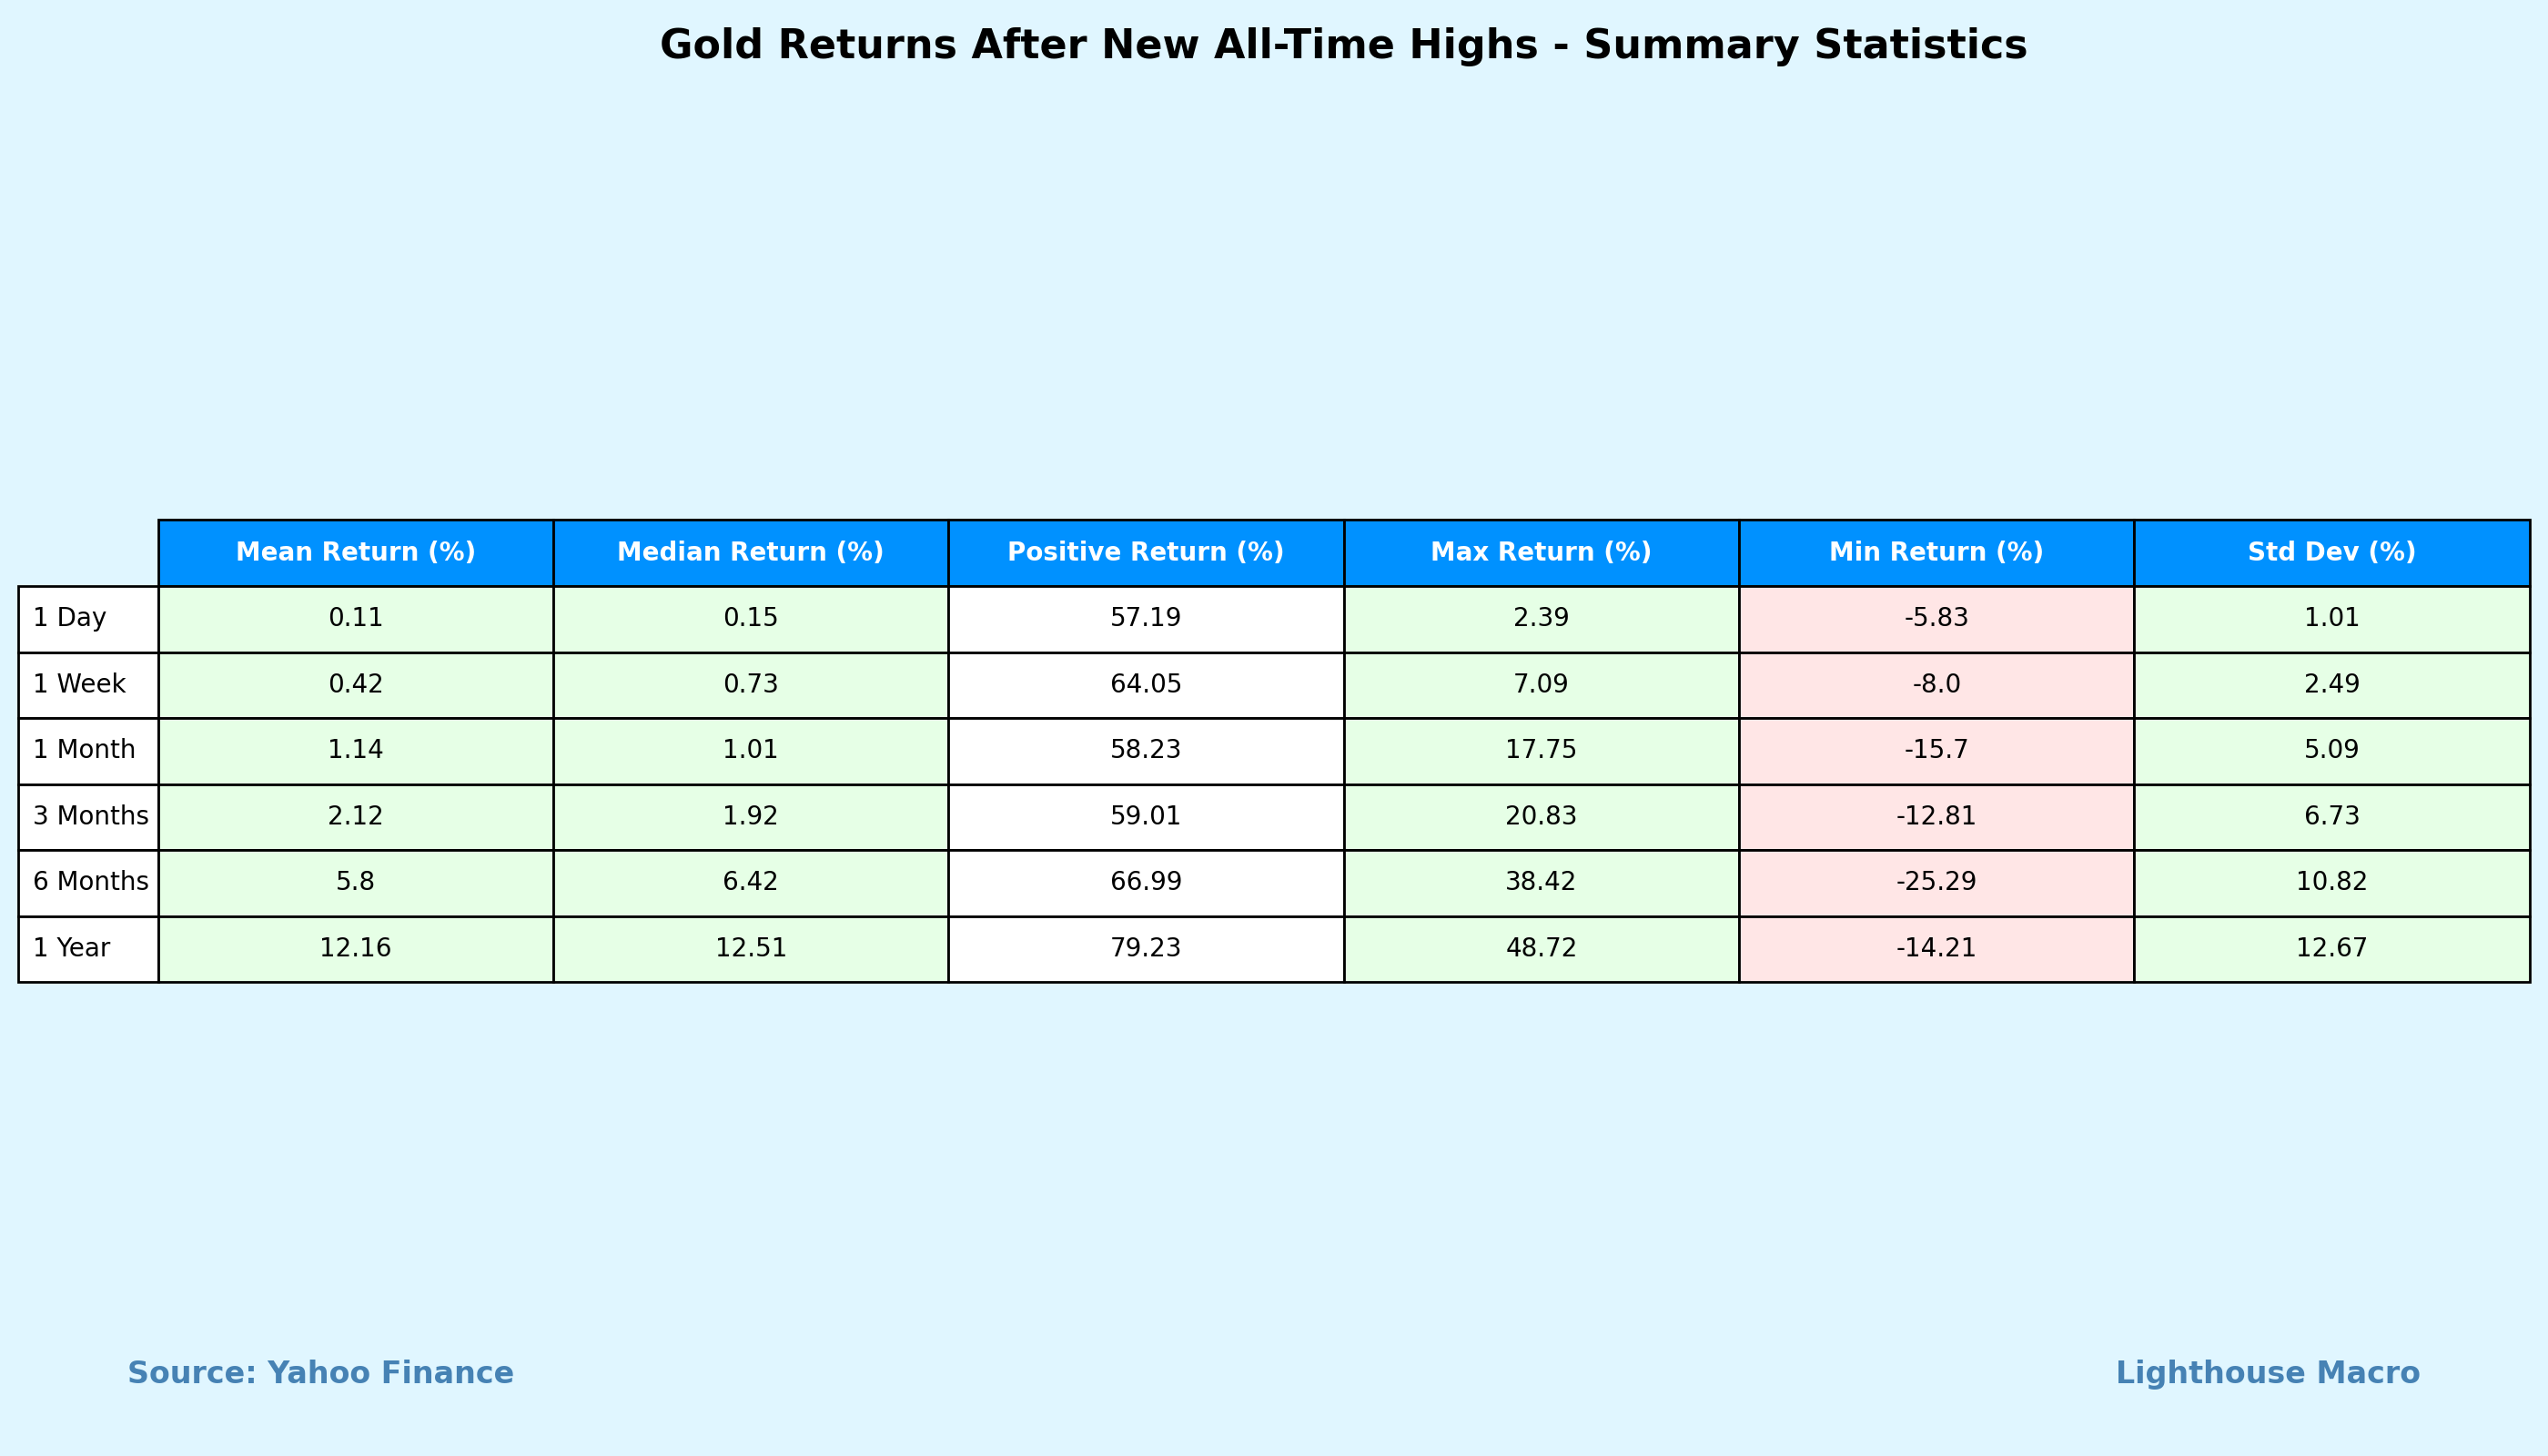
1-day returns: Positive 57% of the time with 0.11% average return
1-week returns: Positive 64% of the time with 0.42% average return
1-month returns: Positive 58% of the time with 1.14% average return
3-month returns: Positive 59% of the time with 2.12% average return
6-month returns: Positive 67% of the time with 5.80% average return
1-year returns: Positive 79% of the time with 12.16% average return
The risk-reward profile also improves dramatically with longer holding periods, suggesting that investors should consider maintaining gold positions even after new highs are reached.
Current Macroeconomic Drivers of Gold's Continued Performance Through Early 2025
Gold's exceptional performance from 2024 through March 2025 is being fueled by a confluence of macroeconomic factors. Much of gold's price increase over the past 15 months can be attributed to rising global economic uncertainty, which has reached levels comparable to the peak of the COVID pandemic in 2020. This uncertainty spike appears particularly connected to trade policy concerns since November 2024, including threats of substantial tariff increases on major U.S. trading partners and their potential impact on inflation, global supply chains, and geopolitical tensions.
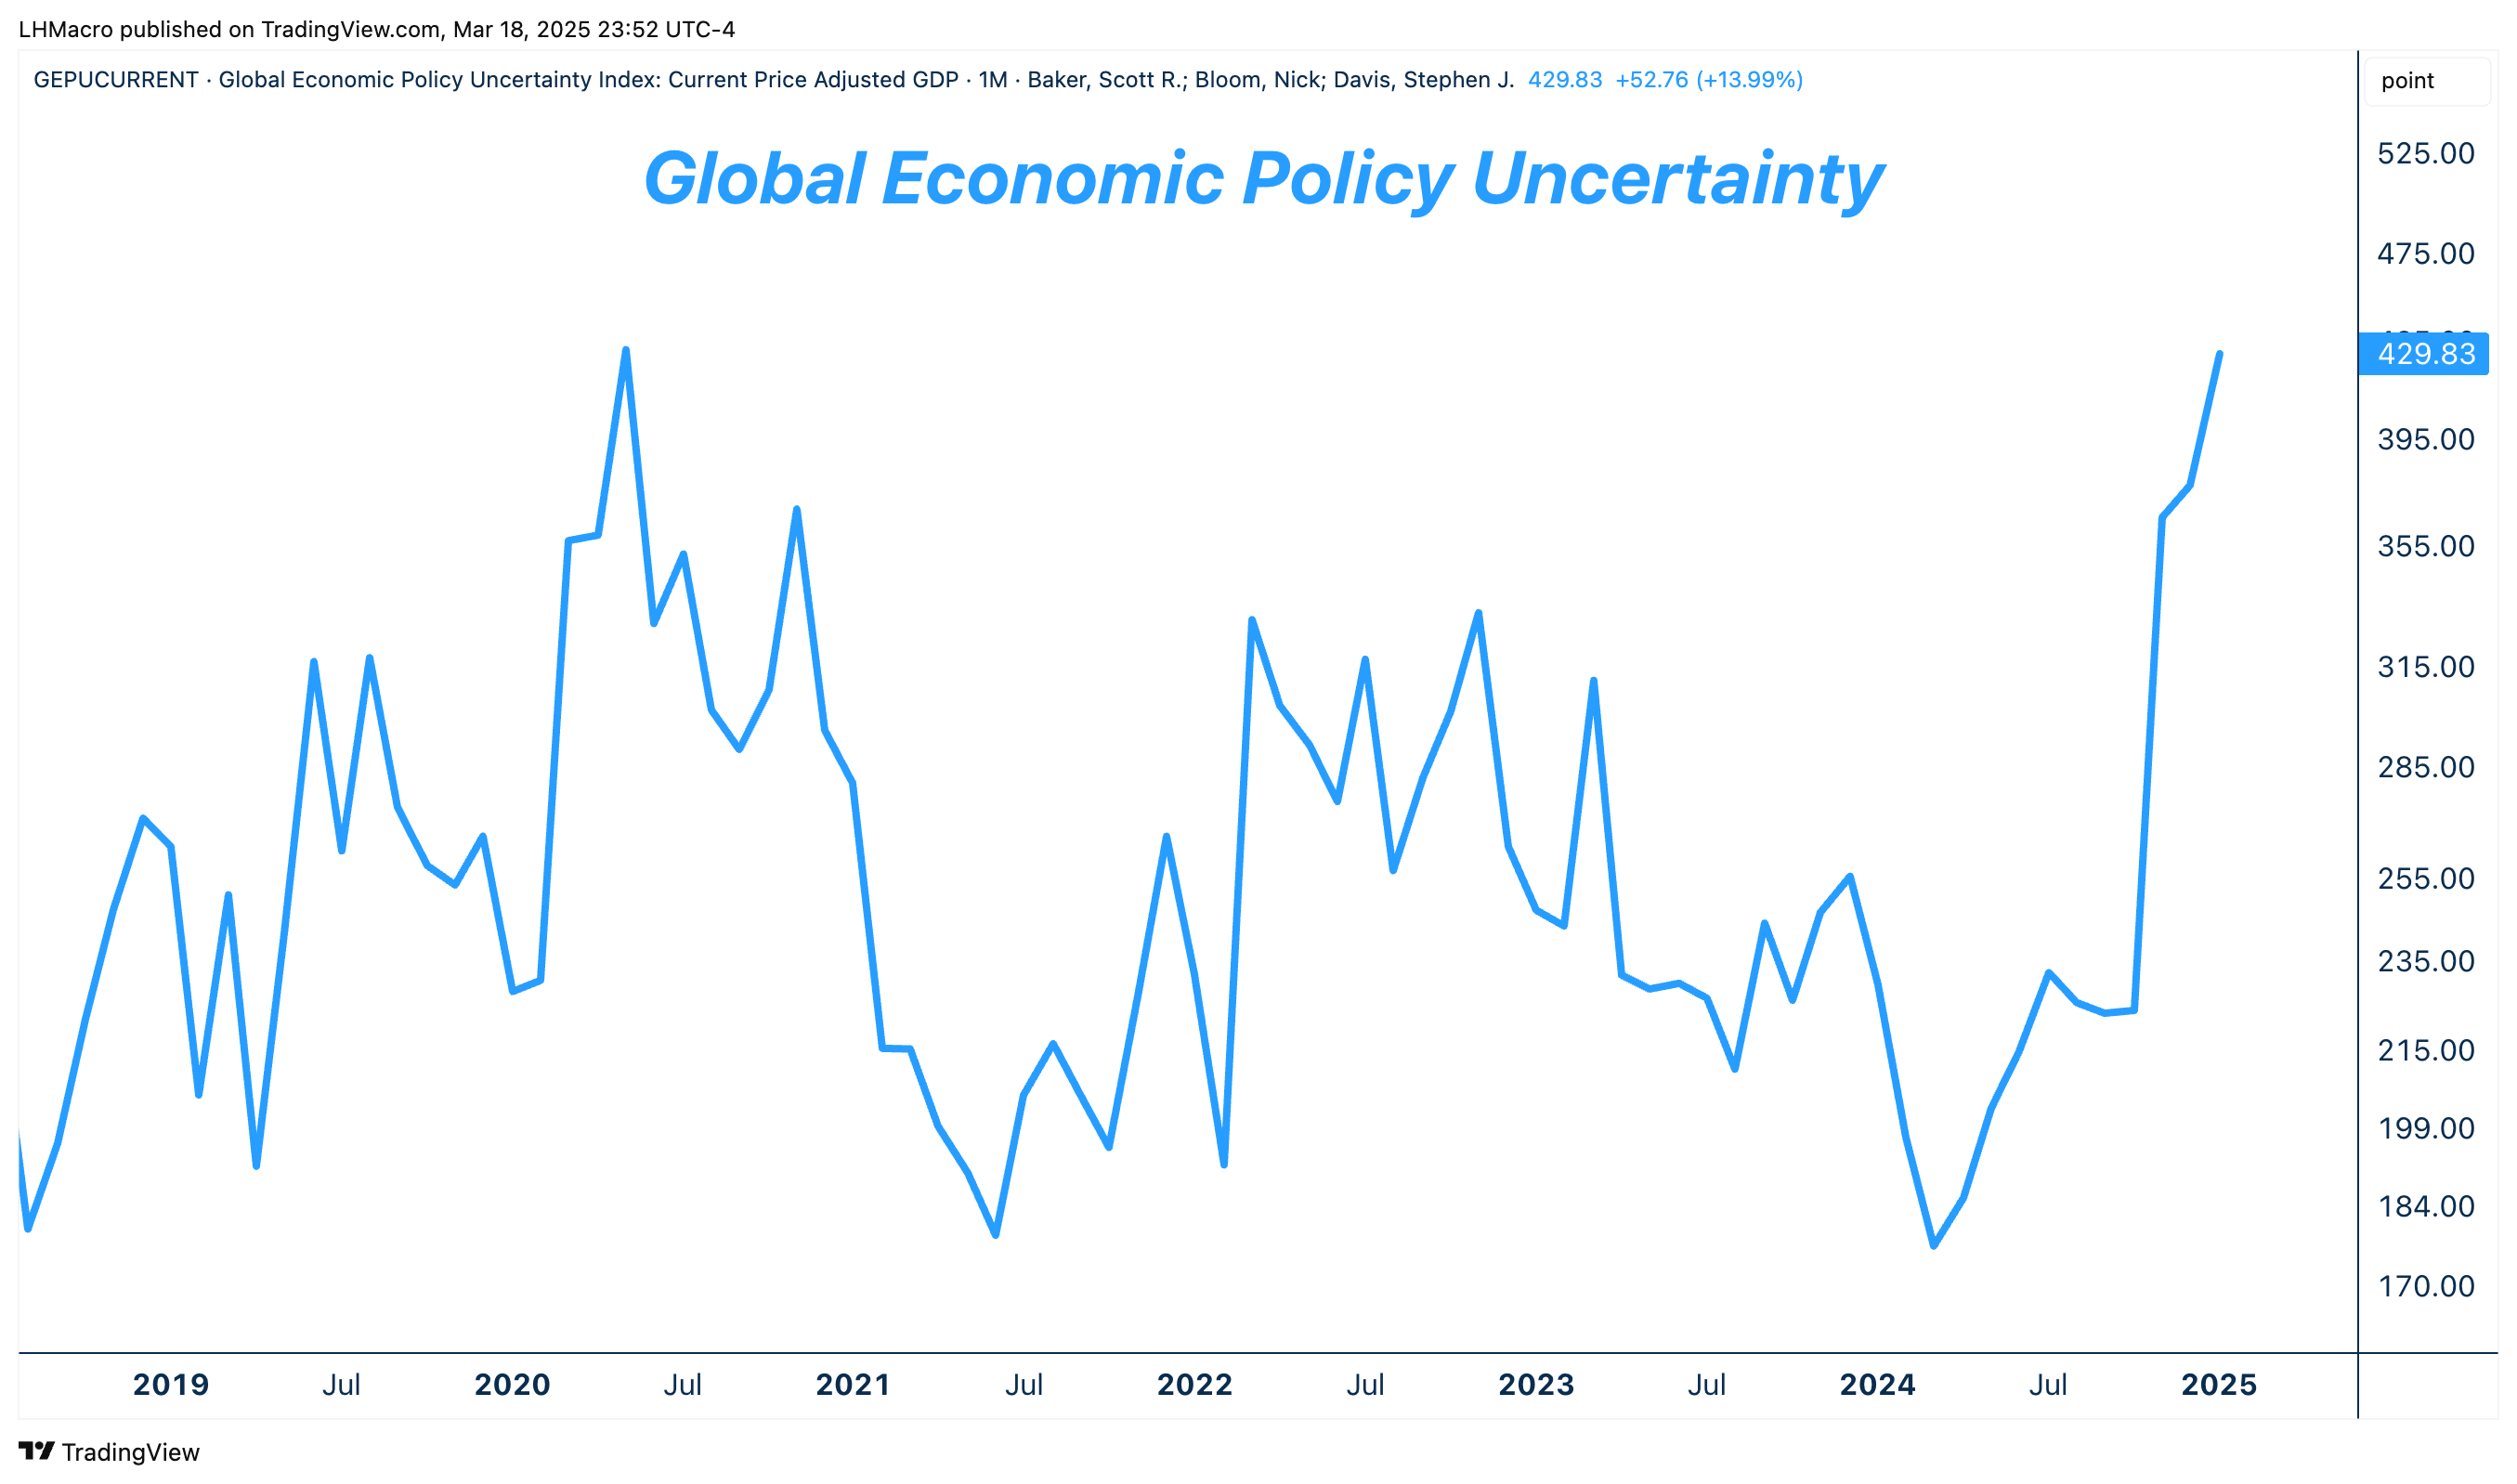
Persistent inflation concerns, despite moderating headline numbers, continue to drive investors toward hard assets as a store of value, with rising inflation expectations contributing to gold's price surge. Geopolitical tensions, particularly the protr`acted conflicts in Ukraine and the Middle East, have heightened global uncertainty, traditionally beneficial for gold.
Central banks have emerged as particularly significant drivers of demand, with data showing they account for 11.5% annual growth in gold demand between 2019-2024, dramatically outpacing overall demand growth of just 0.9%. In contrast, traditional gold consumption sectors like jewelry (-1.4%), industrial use (-0.4%), and private investment (-1.5%) have all contracted during this period. This institutional buying reflects central banks' ongoing diversification away from dollar-denominated assets amid geopolitical uncertainties.

The Federal Reserve's rate cutting cycle, which began in late 2024, has weakened the dollar and reduced the opportunity cost of holding non-yielding assets like gold. Additionally, structural supply constraints in gold mining, coupled with robust physical demand from China and India, have created favorable supply-demand dynamics.
The current gold rally bears striking similarities to the surge observed in the first half of 2020 during the COVID pandemic, which was similarly driven by a spike in economic uncertainty. This historical parallel further supports our analysis that new all-time highs in gold often precede continued positive performance rather than signaling a market top.
Conclusion
The historical data challenges the conventional wisdom about buying at all-time highs, at least for gold. Rather than signaling a top, new ATHs in gold have historically been followed by positive returns, especially over longer time horizons.
For investors, this suggests:
New gold ATHs should not automatically trigger profit-taking
The clustering of ATHs may signal sustained momentum rather than exhaustion
Longer holding periods after ATHs have historically yielded better risk-adjusted returns
With central banks continuing to be significant net buyers of gold while traditional demand sectors show negative growth, the institutional support for gold prices appears robust. This structural shift in demand patterns, combined with our historical analysis of gold's positive performance following ATHs, suggests that the current gold rally may have further room to run despite reaching record price levels.
As gold continues to make new highs in 2024, this historical context provides valuable perspective for investors considering their positioning in the precious metal.