

The Beam & LNMS Report
Noteworthy Narratives In Advance of a New Year


For anyone who missed it: Less Noise, More Signal released their year-end “macro voices” report, and I was fortunate to be included alongside a strong group across TradFi and DeFi. My section touches on the data deluge investors now face — and why only a durable, disciplined framework can keep signal from being overwhelmed by noise.
To build on the themes from that report, here is the latest Beam, covering the liquidity trap, labor-market deterioration, credit mispricing, and the divergence between surface calm and underlying system stress. Full Note: https://lnkd.in/egtg4Jce
Next up…
THE BEAM
1. The Macro Trap: Liquidity Starvation vs. Systemic Risk
The cycle is entering a phase where liquidity starvation and systemic risk are beginning to overlap.
The top panel of our dashboard plots the Liquidity Cushion Index (LCI) against the Macro Risk Index (MRI). LCI has been grinding lower as pandemic-era buffers are drawn down, while MRI has turned consistently positive — a sign of rising macro vulnerability beneath otherwise stable headline conditions.
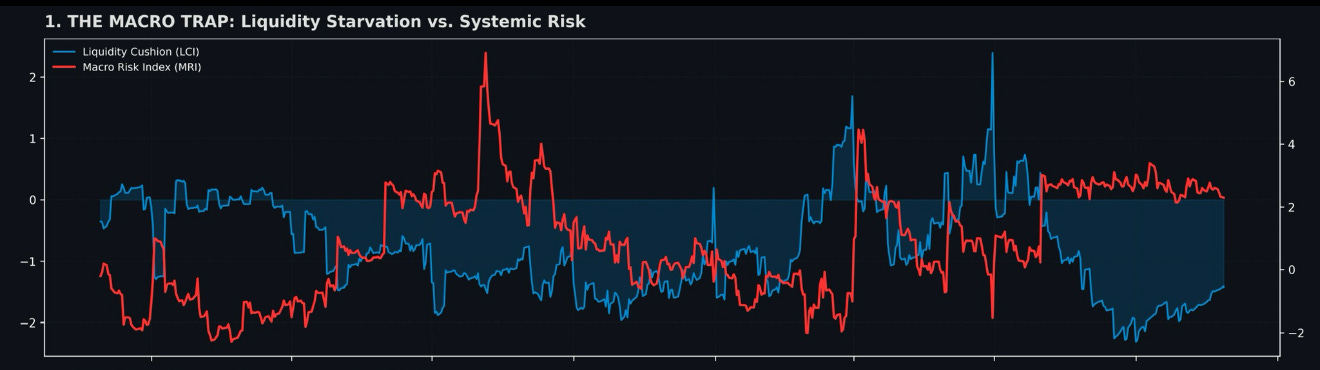
Two structural shifts sit behind that divergence:
• The ON RRP facility has effectively moved from primary shock absorber to rounding error after a ~93% drawdown from the peak.
• Bank reserves are hovering near the Fed’s “ample floor,” the minimum level of liquidity the Fed believes necessary to avoid 2019-style instability.
With QT still running and no RRP buffer left, incremental shocks now hit reserves, repo, and dealer balance sheets directly.
2. The Labor Jaws: Structural Rot Beneath the Surface
The middle panel shows the Labor Dynamism Index (LDI) and Labor Fragility Index (LFI) forming a widening “jaws” pattern.
Flows-based labor data continues to deteriorate even as the headline unemployment rate remains low:
• Quits have drifted toward ~2%.
• Job openings per unemployed have slipped below 1.0.
• Long-term unemployment has risen back toward post-COVID highs.
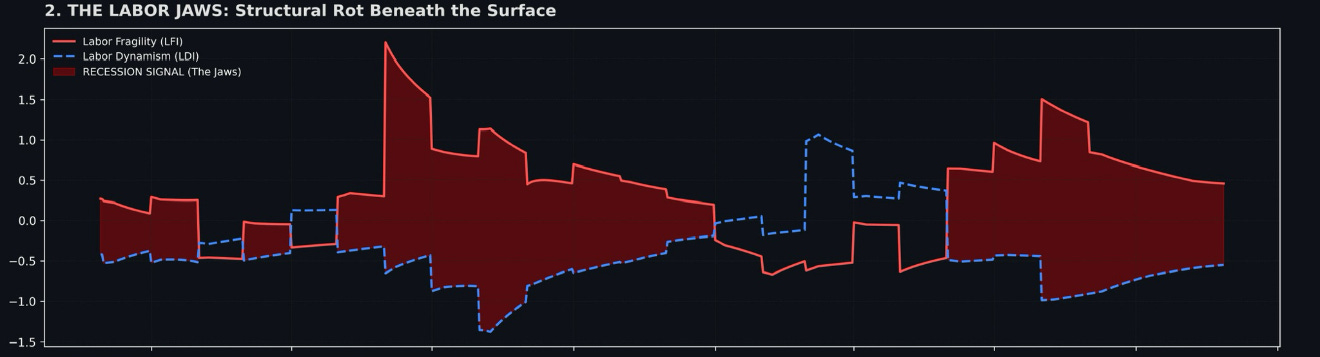
LDI — quits, hiring, openings — has rolled negative.
LFI — layoffs, long-term unemployment, part-time for economic reasons — is grinding higher.
Historically, this structure leads recession by several quarters.
3. The Crypto Escape: Offshore Re-Leveraging
Stablecoin Momentum has re-accelerated while BTC risk premium has compressed toward zero.
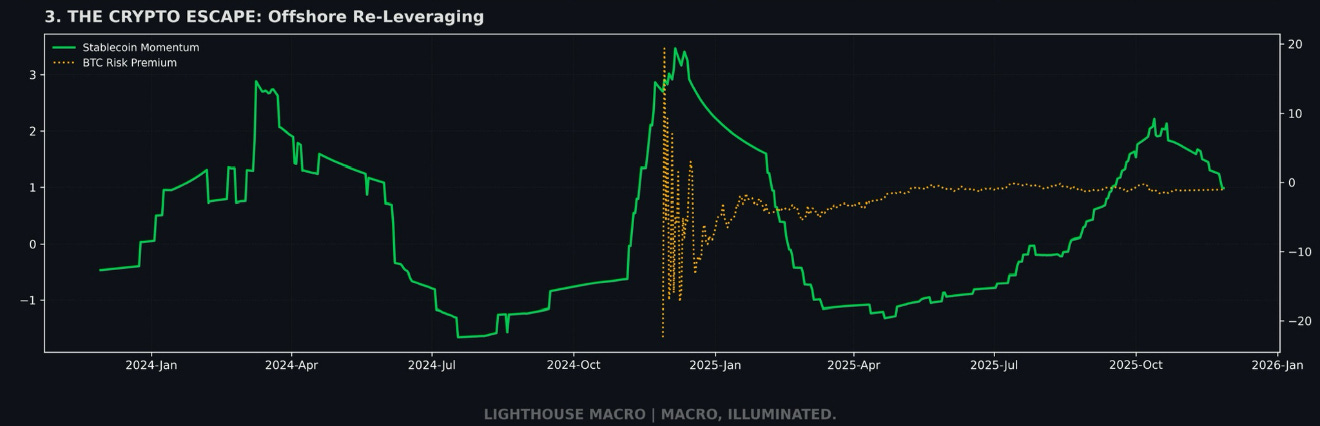
This combination typically signals:
• Offshore USD balance sheet expansion.
• Liquidity being intermediated through the least regulated pipes.
• Speculative carry outpacing real-economy investment.
Crypto is once again functioning as the system’s liquidity escape valve.
4. Term Premium Paradox: Easing Into Higher Duration Risk
The next chart plots the 10-year term premium against the Fed funds rate.
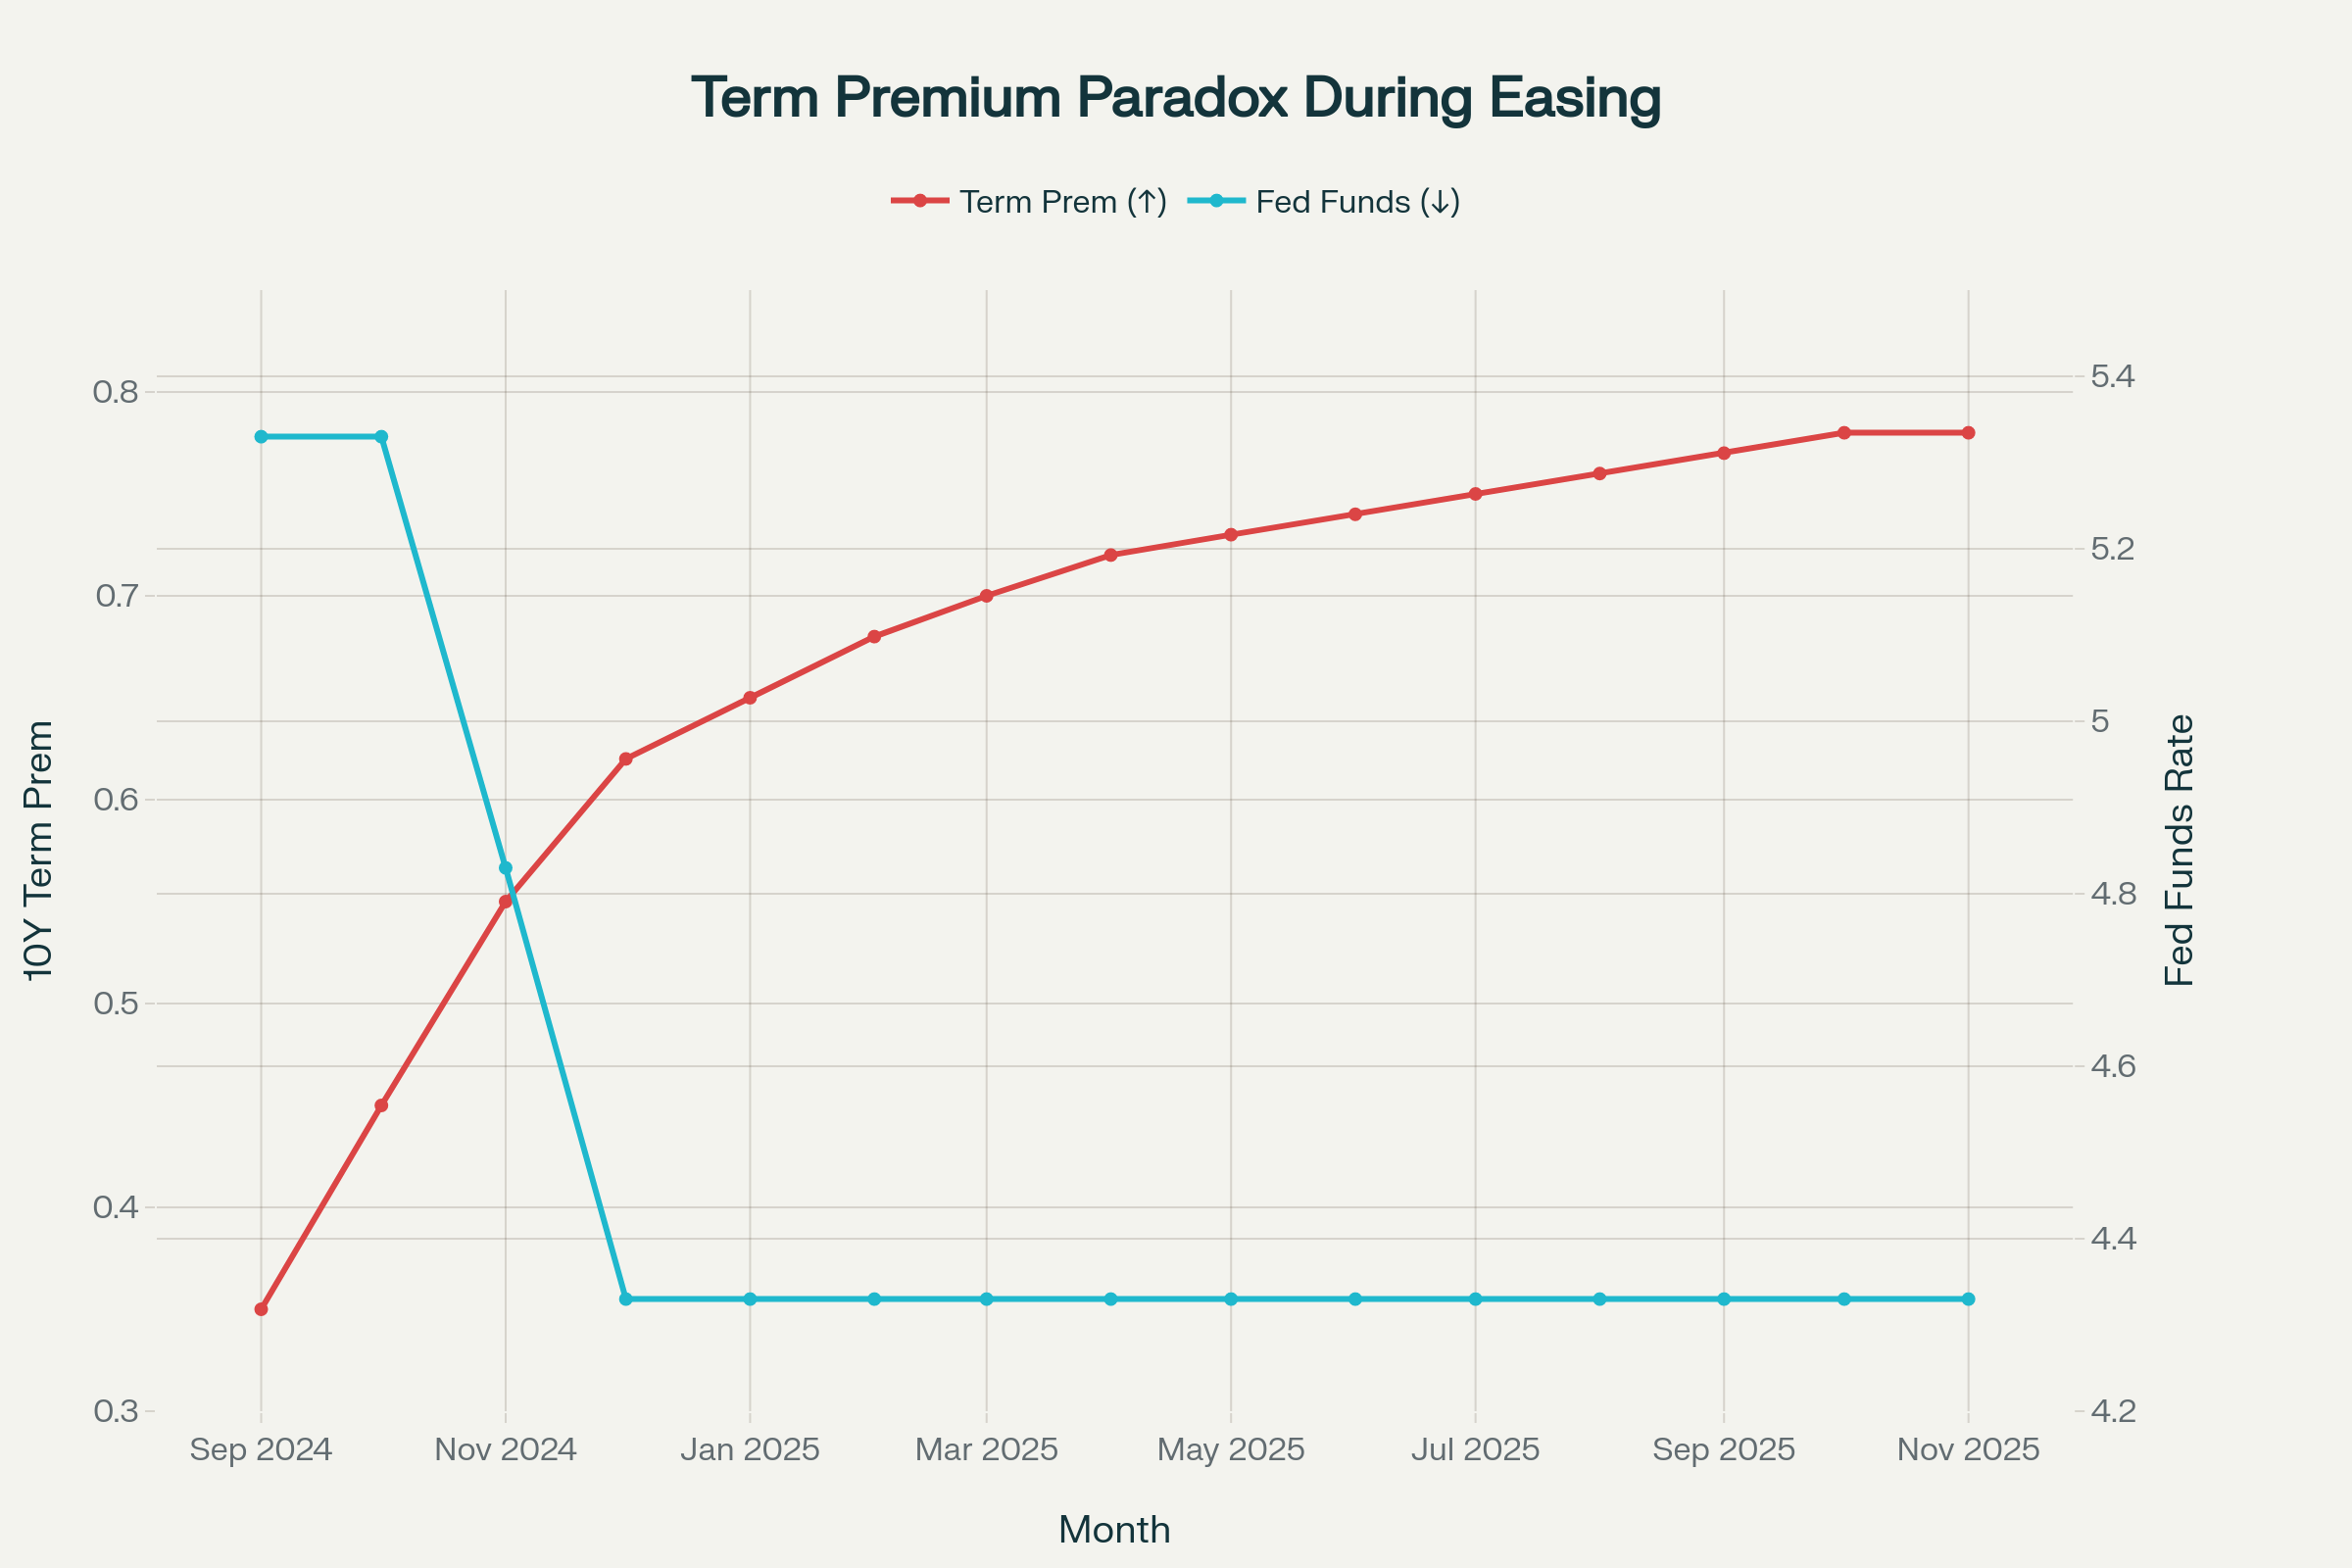
• Fed funds have moved lower.
• The term premium has risen steadily.
This reflects persistent concern about Treasury supply, dealer absorption capacity, and declining foreign official demand.
5. Dealer Saturation: The 70% Concentration Wall
Primary dealer data shows Treasuries now account for roughly 70% of total securities inventory — the highest share in over a decade.
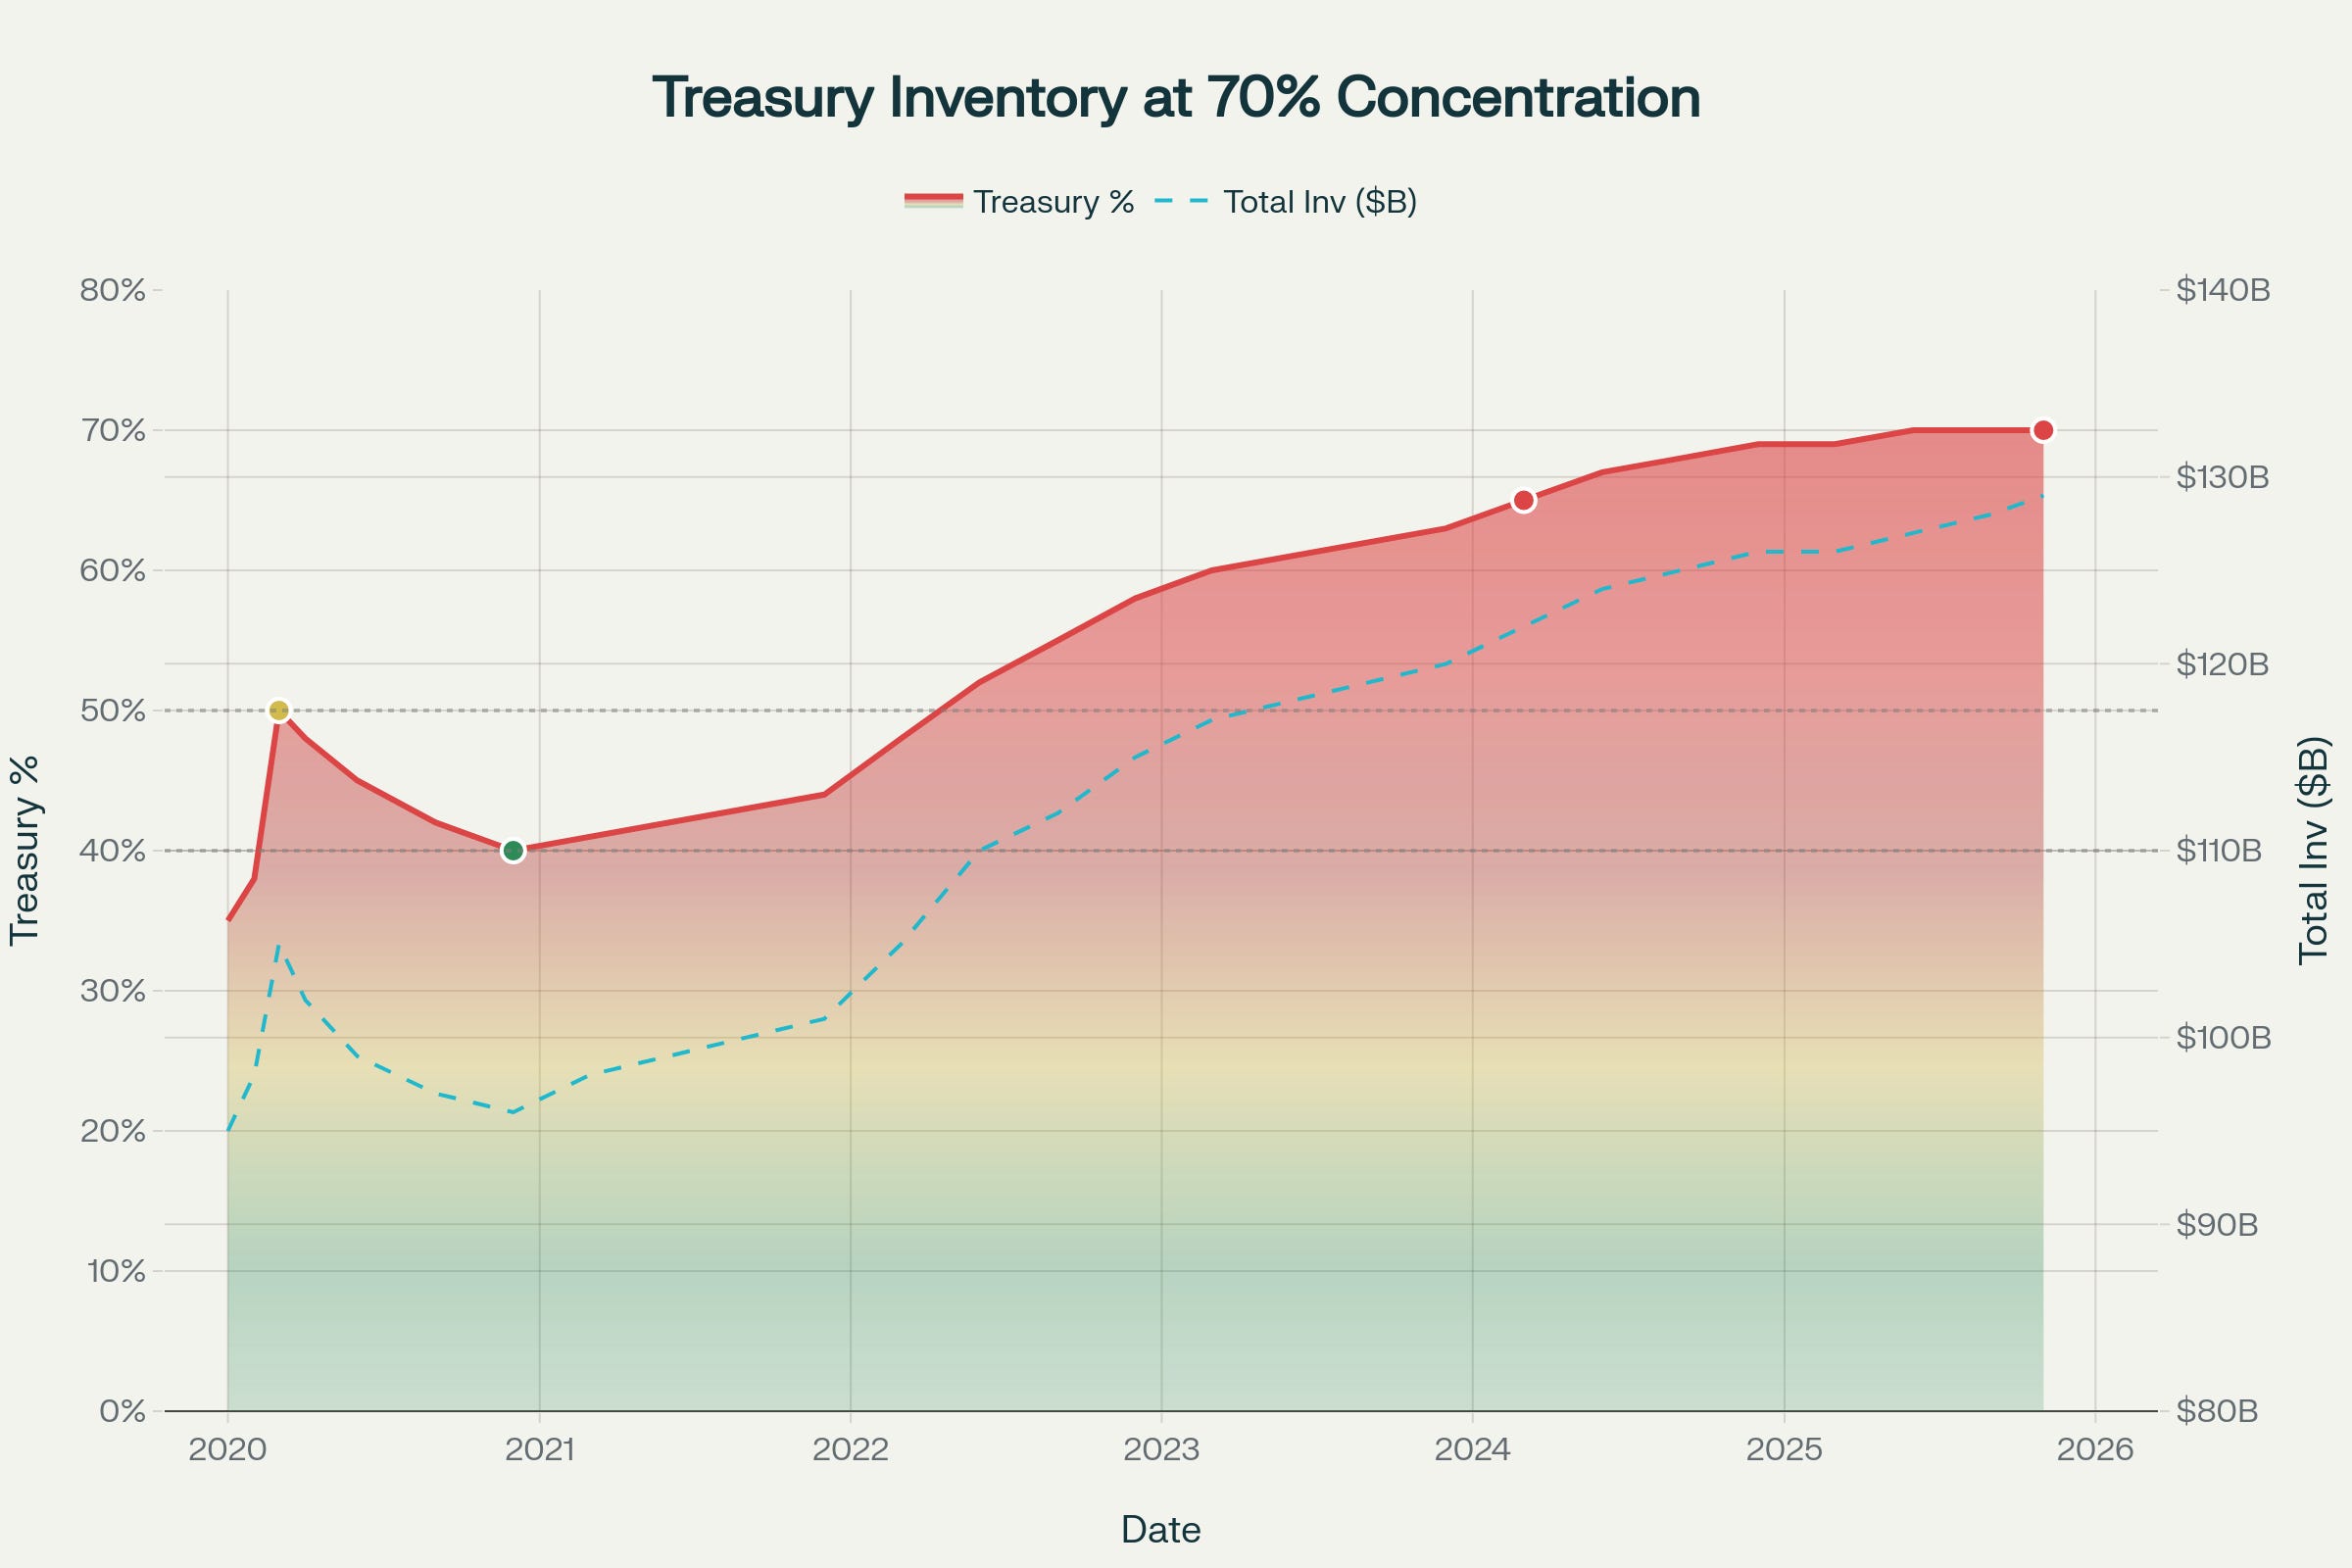
At these concentrations:
• Willingness to warehouse additional duration collapses.
• Auctions grow more fragile.
• Duration sell-offs can gap rather than mean-revert.
This is why term premium rises into easing: the marginal intermediary is full.
6. Credit Complacency: Spreads Tight Into Elevated Defaults
The final chart plots high-yield default rates against BBB spreads.
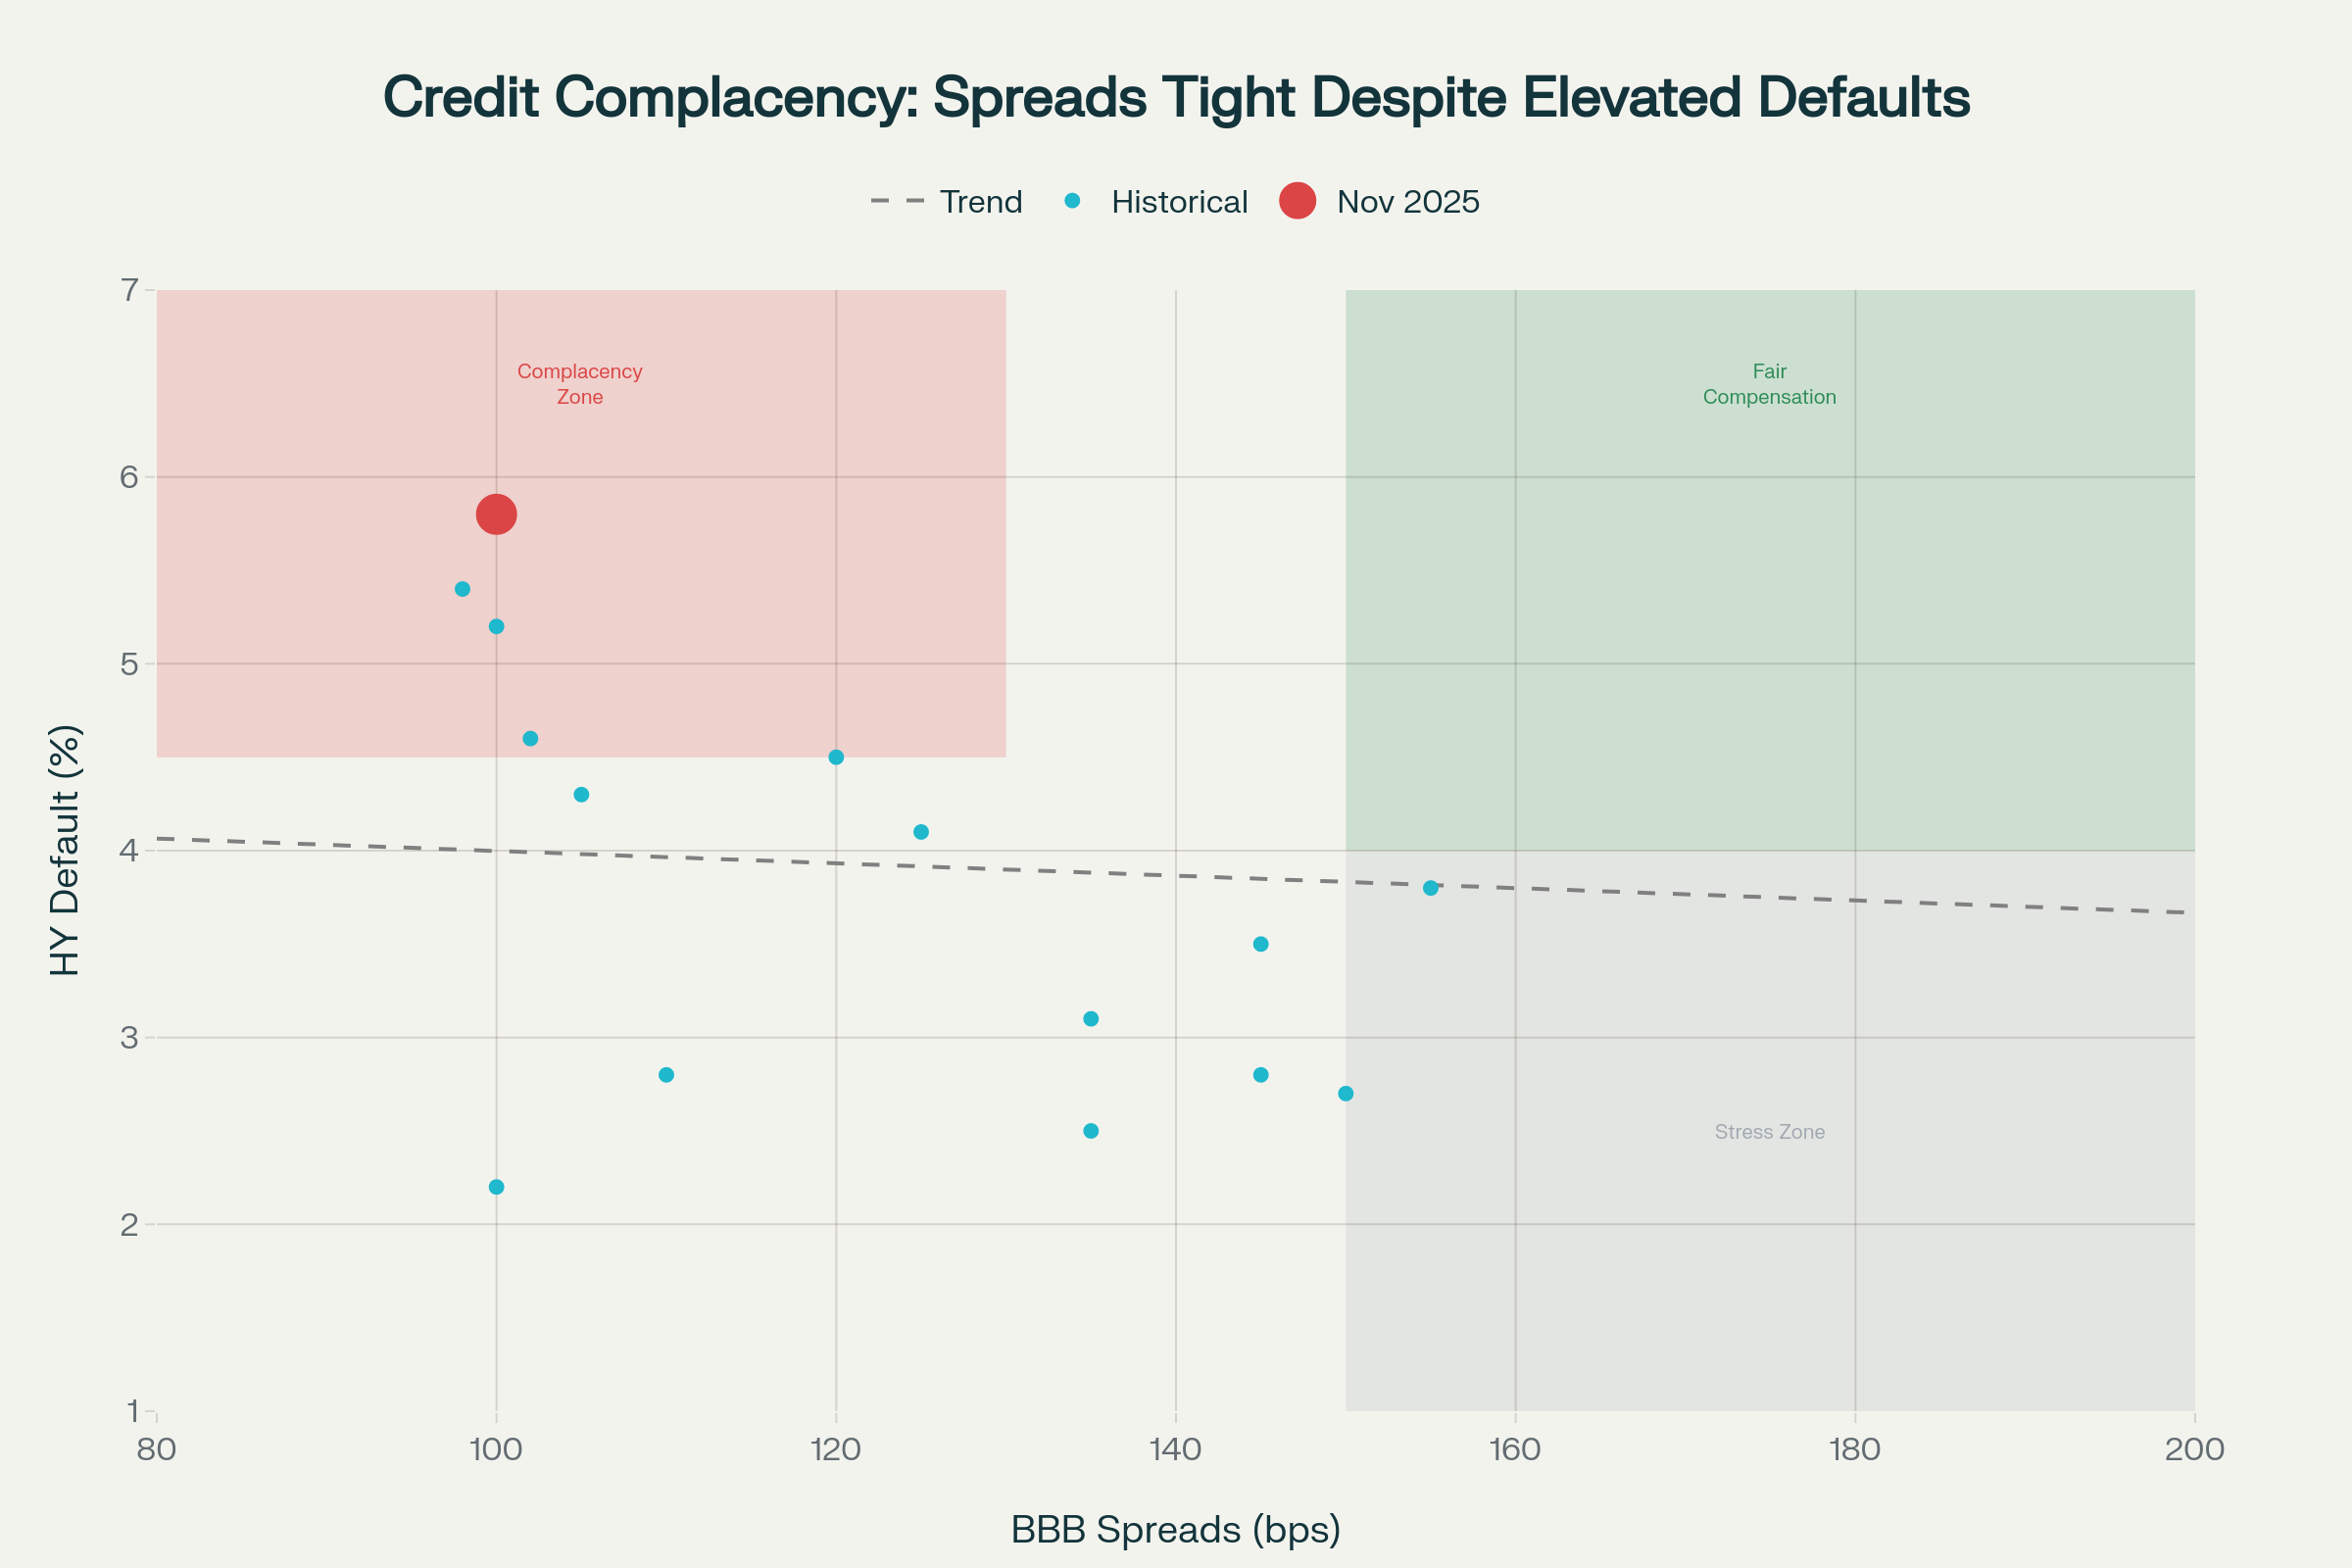
Current positioning sits in the “Complacency Zone”:
• BBB spreads near the 5th percentile of the past two decades.
• HY default rates well above long-run averages.
Historically, this combination does not hold:
• Labor deterioration flows into earnings → downgrades → sharp repricing.
• Credit leads equities by several months.
Credit is priced for perfection while both the plumbing and labor tape show late-cycle characteristics.
7. The Divergence Trap
Across liquidity, labor, and credit, the same pattern emerges:
• Liquidity buffers (RRP, reserves) are exhausted.
• Labor flows are weakening.
• Term premium is rising into easing.
• Dealer balance sheets are saturated.
• Credit markets are priced for a benign macro path.
• Crypto is re-leveraging offshore.
On the surface: strong index levels, subdued volatility, tight credit.
Underneath: exhausted backstops, fraying labor momentum, saturated dealers.
The global liquidity pool has been pushed out along the risk and duration curve just as the pipes carrying that liquidity lose slack. Upside is slow carry; downside is convex if flows reverse.
8. 3–6 Month Playbook
Regime: Late-cycle disinflation with rising term premium and credit fragility.
Direction: Goldilocks → stalled growth, one misstep from recession.
Rates
• Favor front-end duration over 10s and 30s.
• Use conditional steepeners and limited-loss structures.
Credit
• Underweight HY, especially CCCs.
• Own IG protection; HY–IG decompression attractive.
Equities
• Fade high-multiple growth and late-cycle cyclicals.
• Tilt toward quality balance sheets and stable cash-flow models.
FX & Crypto
• USD supported if the divergence snaps.
• JPY optionality attractive on rates stress.
• Crypto remains liquidity beta — strong on inflow, vulnerable on unwind.
9. Risk Flags & Invalidation
Breakers or delays to this thesis include:
• A rebound in labor dynamism (quits rising, openings per unemployed > 1.2).
• A material liquidity policy shift (QT taper, UST buybacks).
• Credit widening without default deterioration (proactive repricing).
• Sharp contraction in stablecoin supply (offshore deleveraging underway).
Until then: the system is running tighter than headline conditions suggest.
The longer the divergence persists, the more convex the adjustment becomes.
That’s our view from The Watch. Fair winds and following seas… but if not, we’ll be sure to keep the light on.
Note: Paywall goes into effect after The Horizon report. For those who wish to lock in a lifetime rate, founding membership remains open through the New Year.