

THE HORIZON | JANUARY 2026
THE HOLLOW RALLY


The S&P 500 has printed fresh highs above 6,900. Volatility is subdued. Credit spreads are tight. On the surface, markets look stable.
Under the hood, the system’s shock absorbers are gone.
This is The Hollow Rally: a regime in which asset prices continue to levitate on residual liquidity, positioning inertia, and passive flows, while the underlying macro and funding architecture deteriorates. The rally does not end because sentiment turns. It ends when the system loses the capacity to absorb stress.
That capacity is now materially diminished.
Something unusual is happening. Equities are making new highs. Volatility sits comfortably in the mid-teens. Credit markets are pricing near-perfection. Yet the buffers that made the post-2020 system resilient—ample reserves, a multi-trillion-dollar RRP facility, and flexible dealer balance sheets—have been quietly exhausted.
Liquidity still exists. But it no longer absorbs risk. It transmits it.
Today we’re releasing the January edition of The Horizon, our macro diagnostic designed to strip away headlines and focus on system function. This report documents how we arrived at a market that looks calm but operates without margin for error, and why the first half of 2026 is likely to be defined by a volatile handoff from liquidity-driven stability to fundamental vulnerability.
We are not calling for an imminent recession. We are documenting a structural change in resilience. The Hollow Rally can persist for weeks or months. But the conditions that will eventually end it are no longer hypothetical. They are already in place.
Key Readings | January 2026
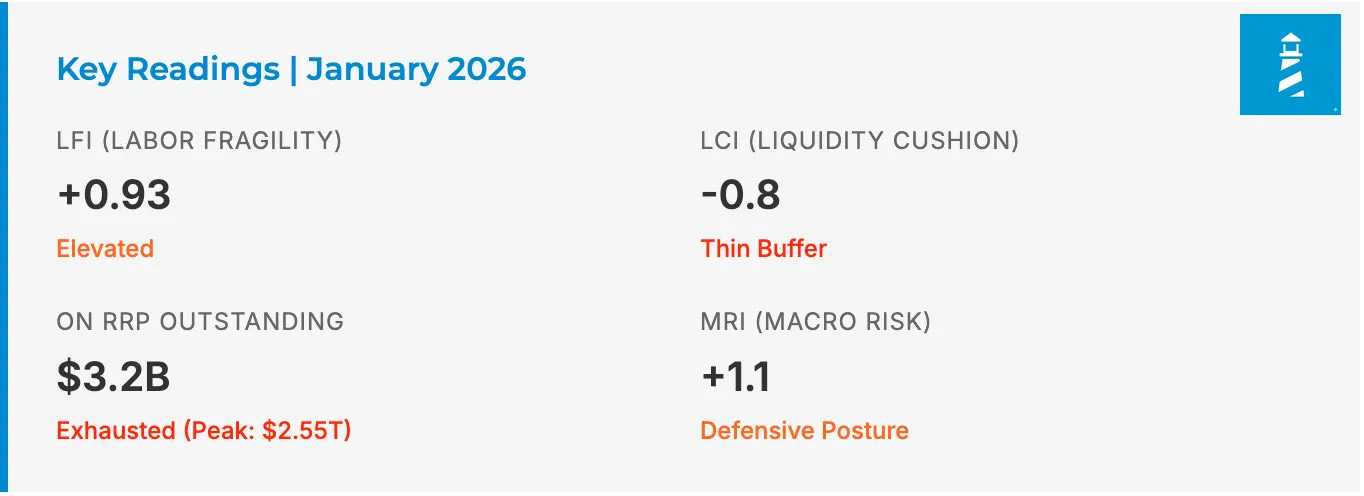
Figure 1: Key Readings | Lighthouse Macro Dashboard
Part I — The Silent Stop
GDP is the paint job. GDI is the engine. And the engine has seized.
The macroeconomic environment of 2026 is characterized by a phenomenon I call The Silent Stop, in which aggregate stability in headline figures masks a rapid erosion of the internal engine of organic growth.
Here is the critical signal: a historic divergence between Gross Domestic Product (GDP) and Gross Domestic Income (GDI), two measures that should converge over time, but currently do not. In a perfect world, these should be identical. One measures what we produce, the other measures what we earn. They no longer converge.
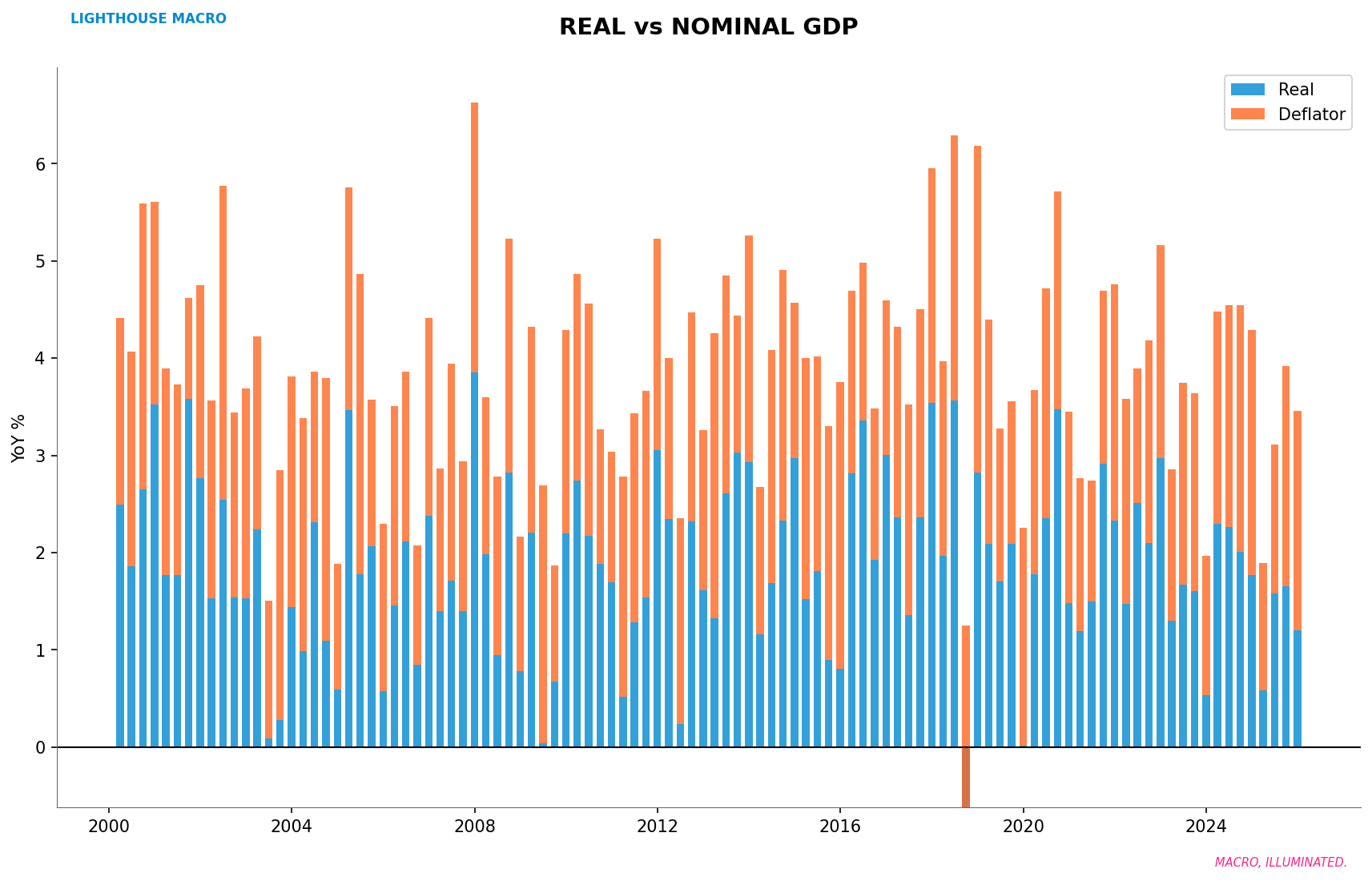
Figure 2: Real vs. Nominal GDP trajectories reveal inflation distortion in headline growth.
Real GDP growth reads +1.8%. Real GDI growth? Flatlined at 0.0%. That’s a 180 basis point statistical discrepancy, the largest since 2008. While GDP–GDI gaps are subject to BEA revisions, divergences of this magnitude have historically coincided with late-cycle or pre-recession dynamics, not durable expansions. The implication: output is increasingly fueled by high-interest credit accumulation and wealth drawdown rather than organic income generation.
We’re not growing. We’re borrowing tomorrow’s consumption to maintain today’s illusion.
The Fiscal Dominance Loop
The federal government is running deficits at a pace typically reserved for recessions or wars, during what headline data calls “expansion.” Federal debt has breached $36.2 trillion. Debt-to-GDP sits at 119%, just shy of the 120% threshold that historically coincides with accelerating interest-growth differentials and reduced fiscal flexibility.
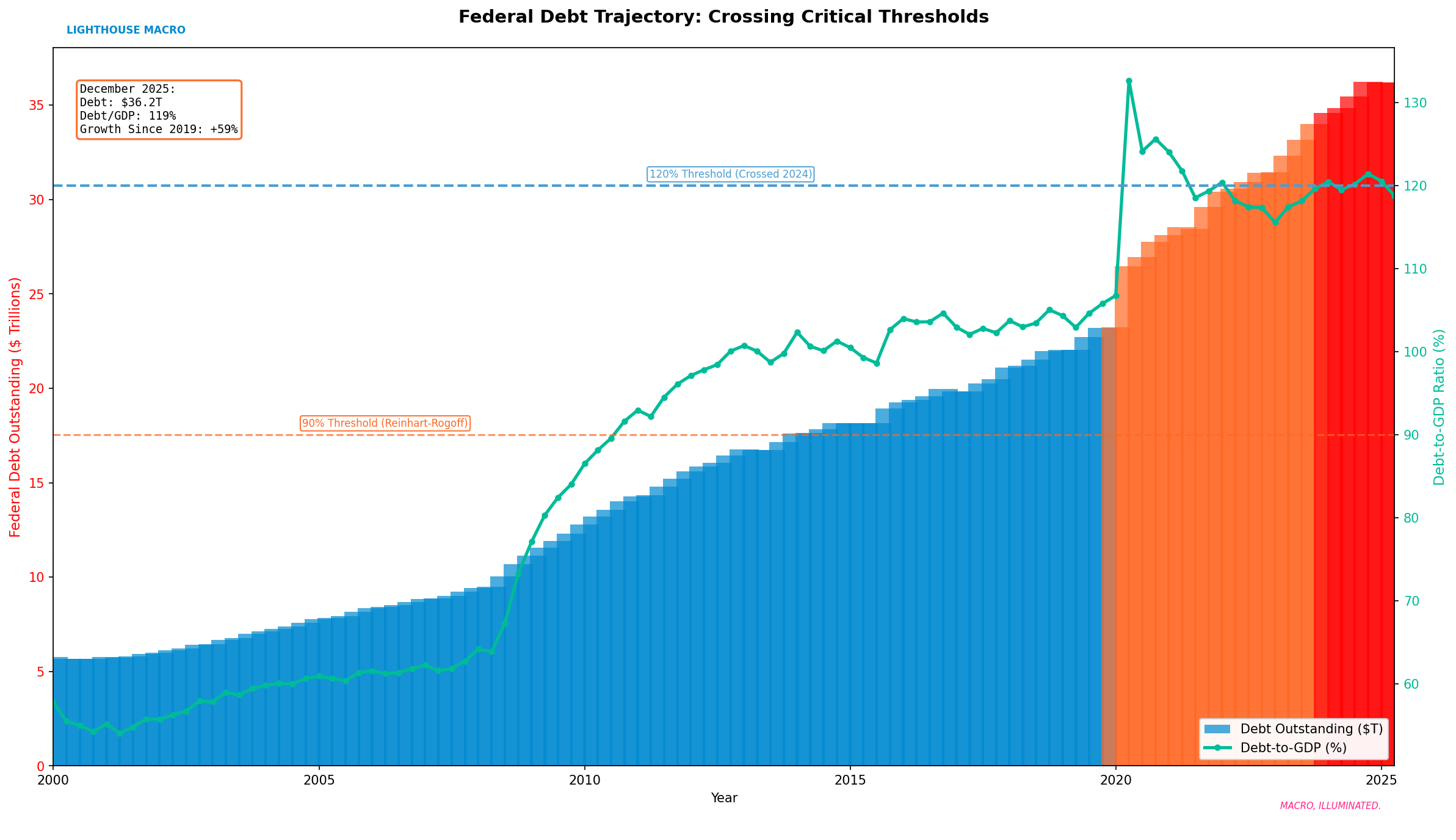
Figure 3: Federal debt trajectory—119% of GDP and climbing.
But here’s what keeps me up at night: Interest expense as a share of federal tax receipts has reached 22%, approaching what I refer to as a fiscal Minsky threshold, where debt service begins to mechanically crowd out discretionary policy choices. When interest payments consume more than a fifth of all tax revenue, and that share is accelerating, the math starts to break.
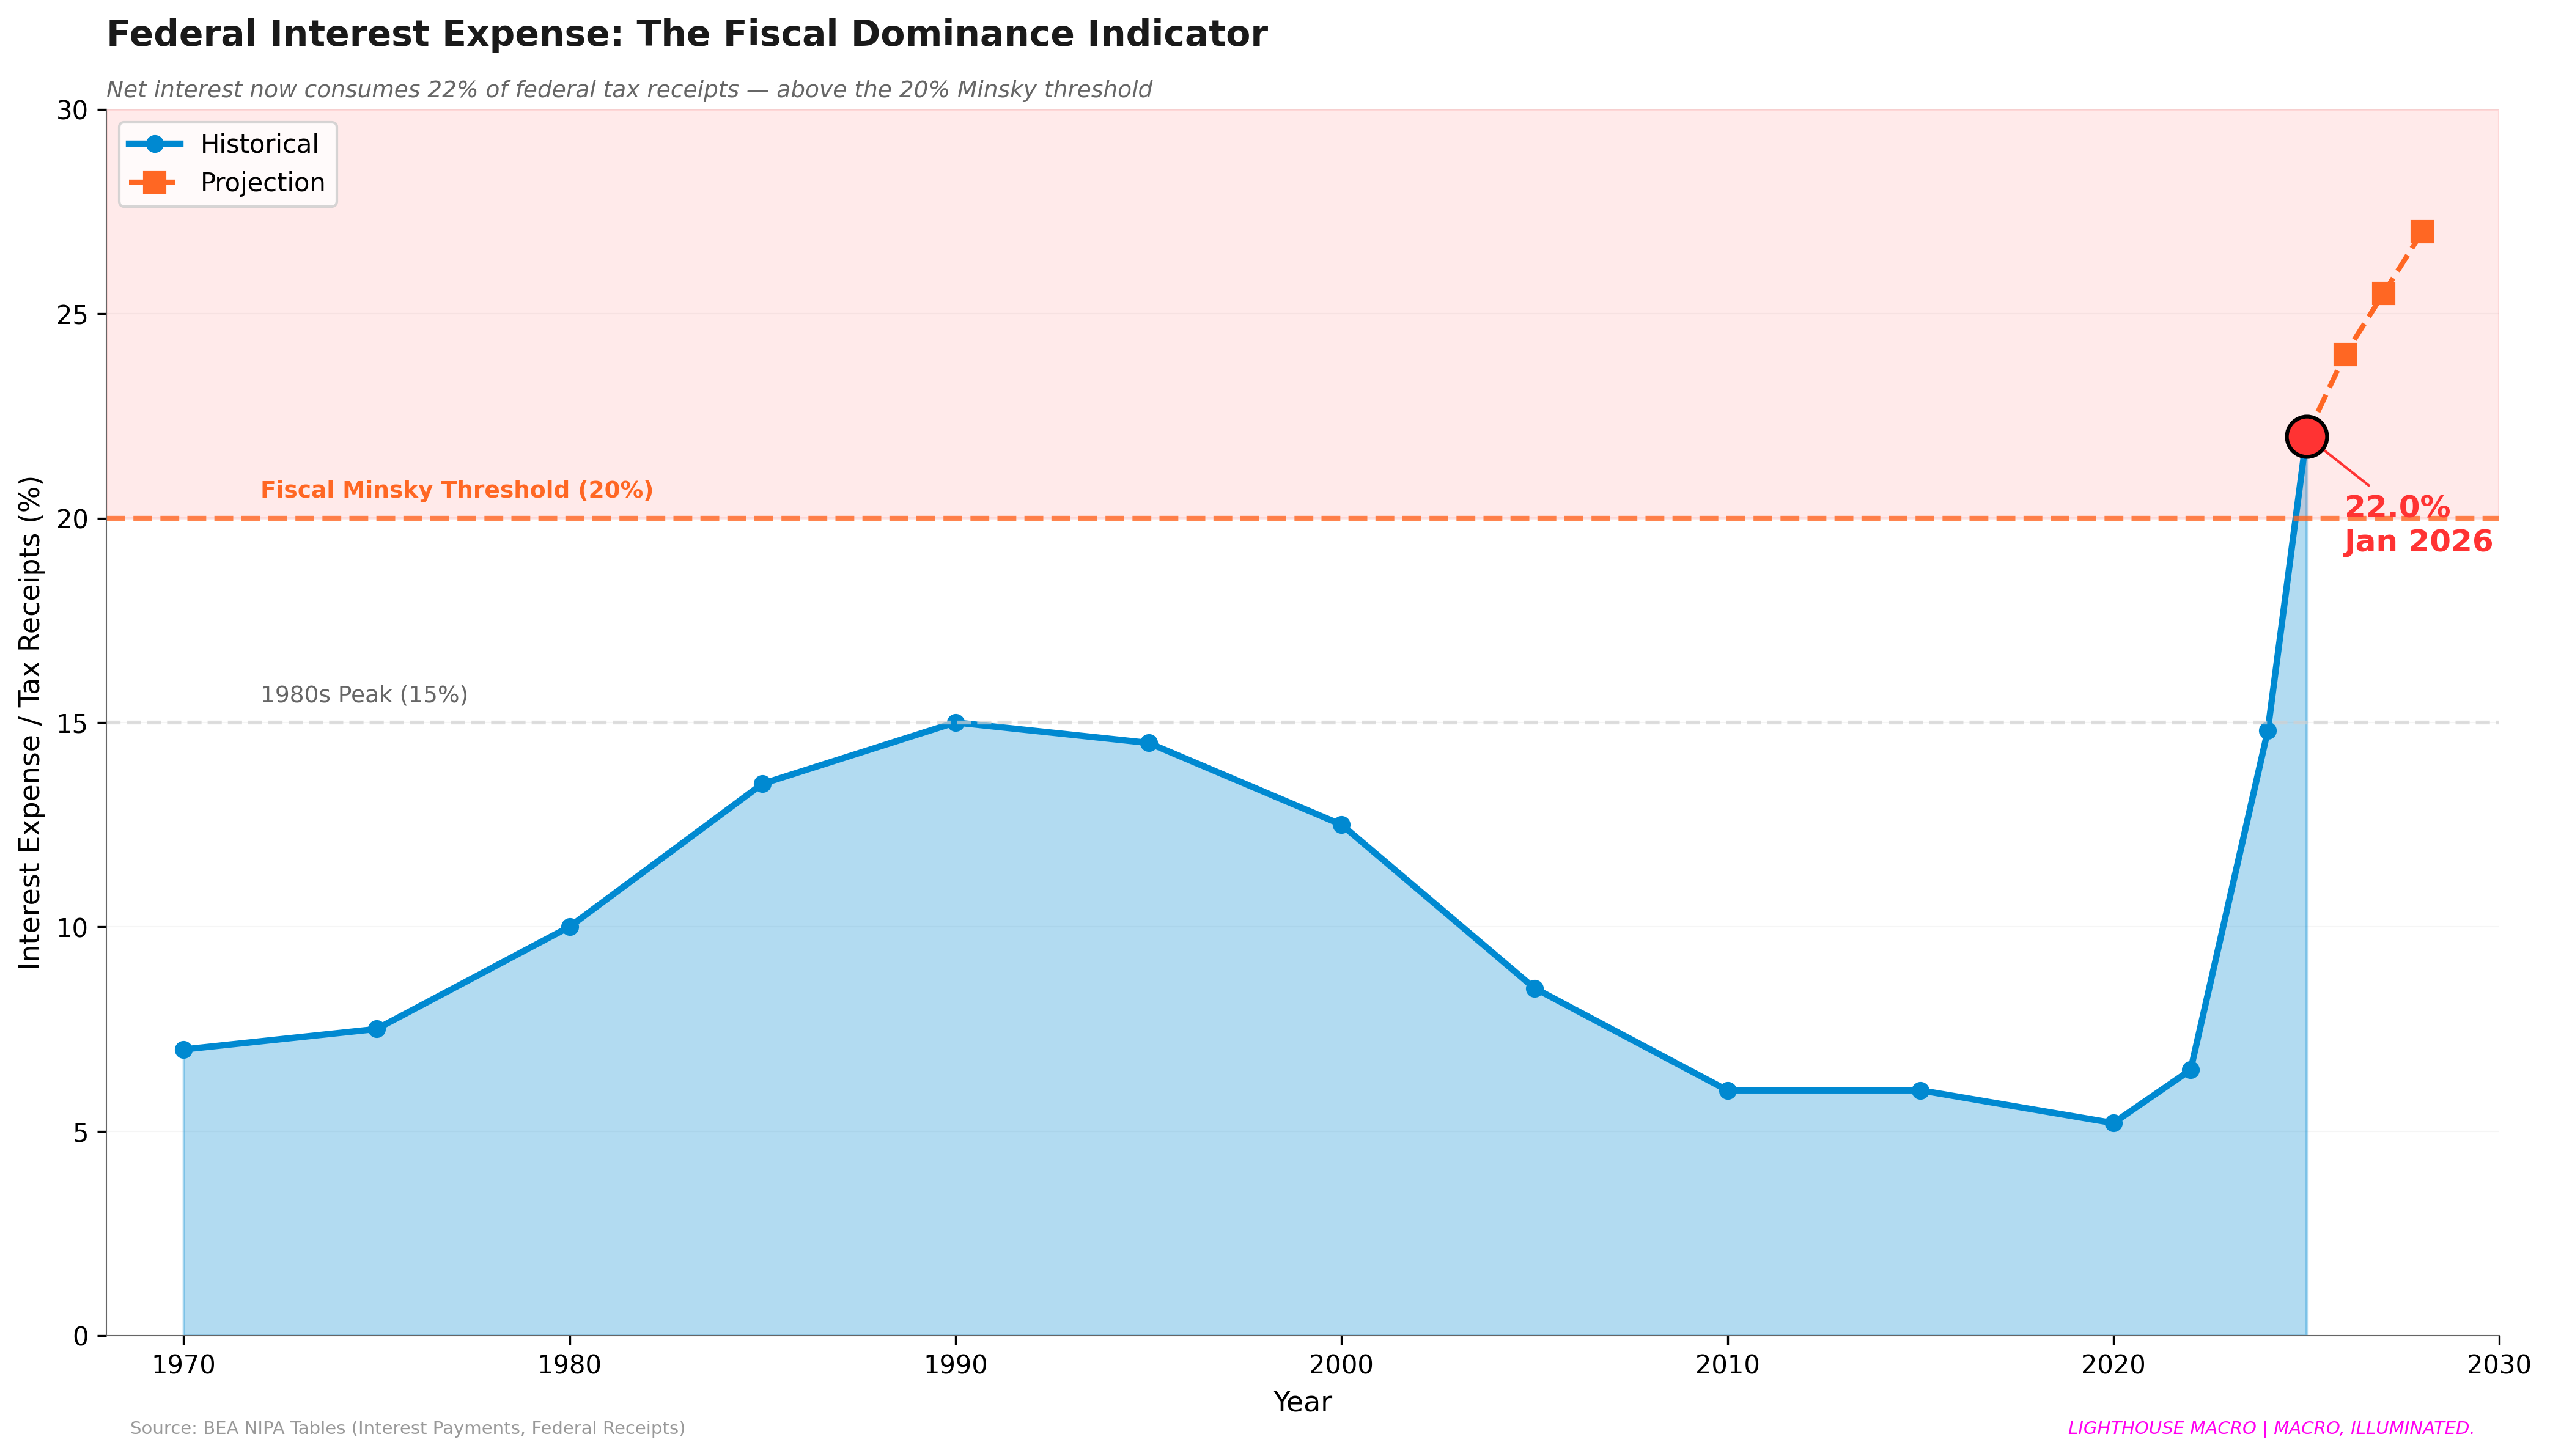
Figure 4: Interest expense as % of tax receipts has risen sharply since 2022.
The Fiscal Dominance Cascade:
The Fiscal Dominance Cascade: Higher yields → Larger interest expense → Larger deficits → More issuance → Higher yields
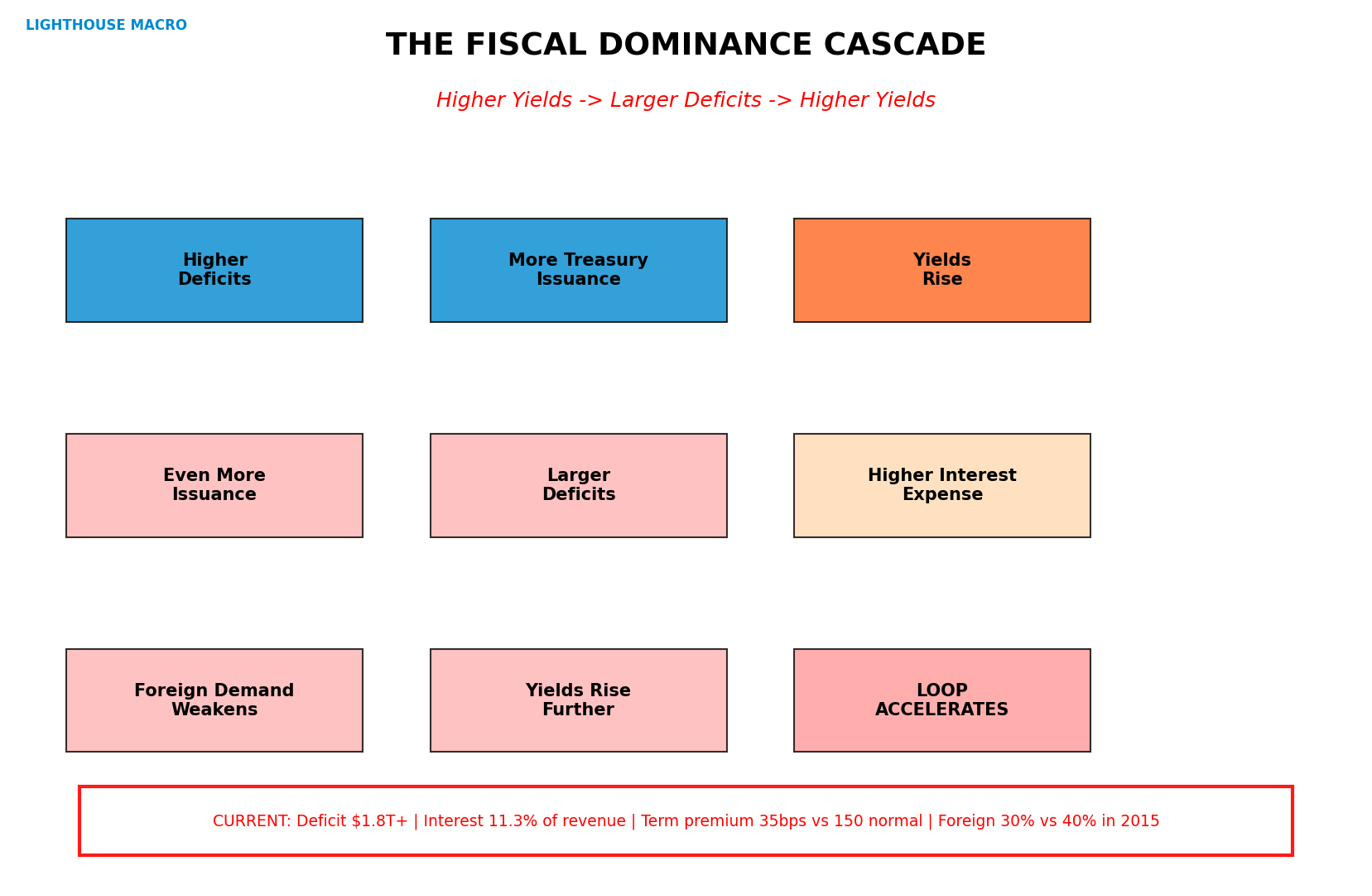
Figure 5: The self-reinforcing fiscal dominance loop is now active.
Part II — Labor: The Freeze Before the Break
The labor market isn’t crashing. It’s freezing. And that distinction matters enormously.
Headline unemployment at 4.4% looks non-recessionary. But the internal dynamics tell a different story. The quits rate has fallen to 2.0%, which is pre-recessionary territory. The mean unemployment duration has increased to 24.4 weeks. Long-term unemployed (27+ weeks) now represent nearly a quarter of all jobless workers.
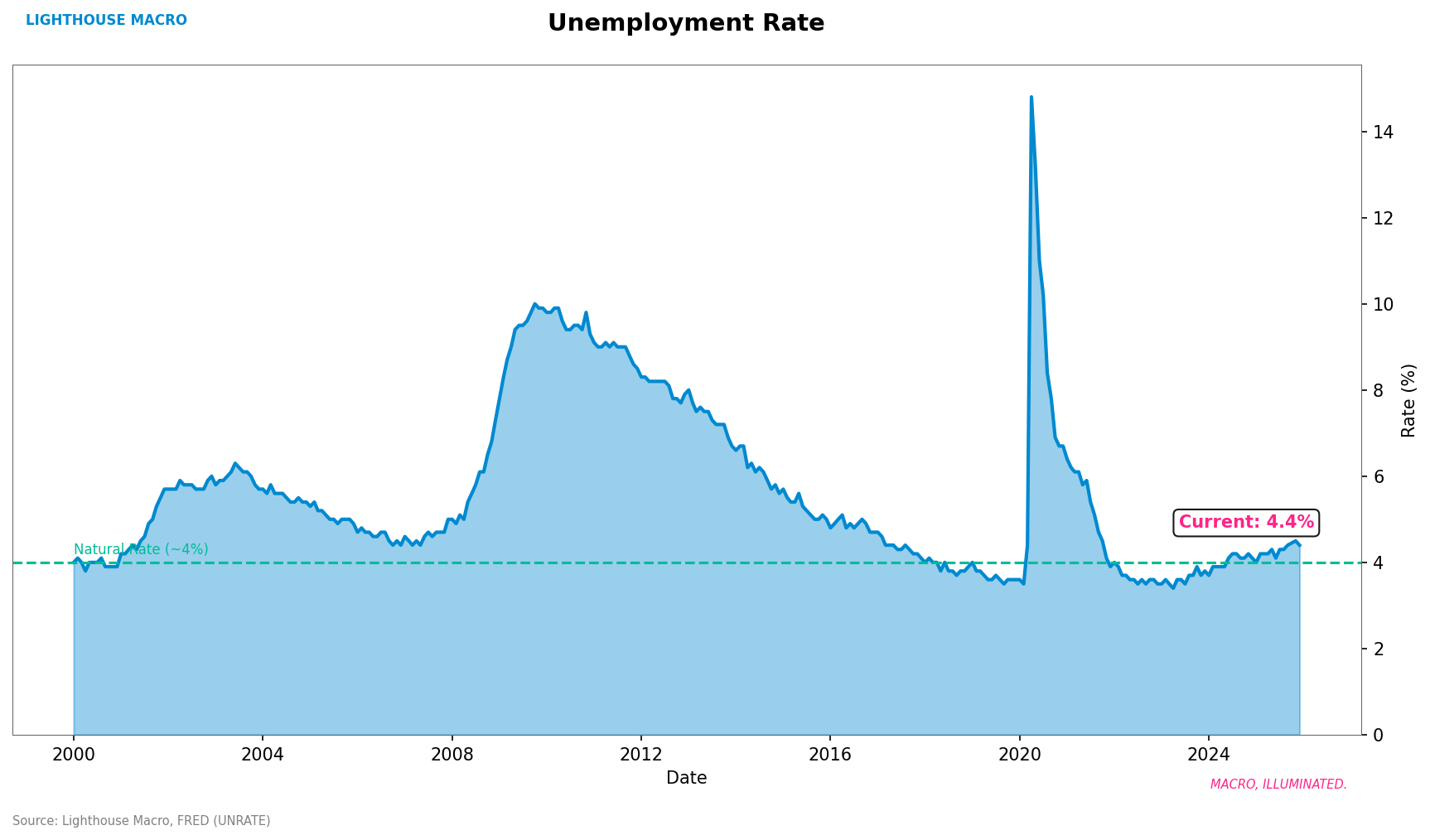
Figure 6: Headline unemployment masks structural deterioration.
The Labor Fragility Index (LFI), our proprietary composite that tracks structural health beneath the headline, is at +0.93 standard deviations. That is elevated territory. Not crisis territory, but sufficiently deteriorated to warrant defensive positioning.
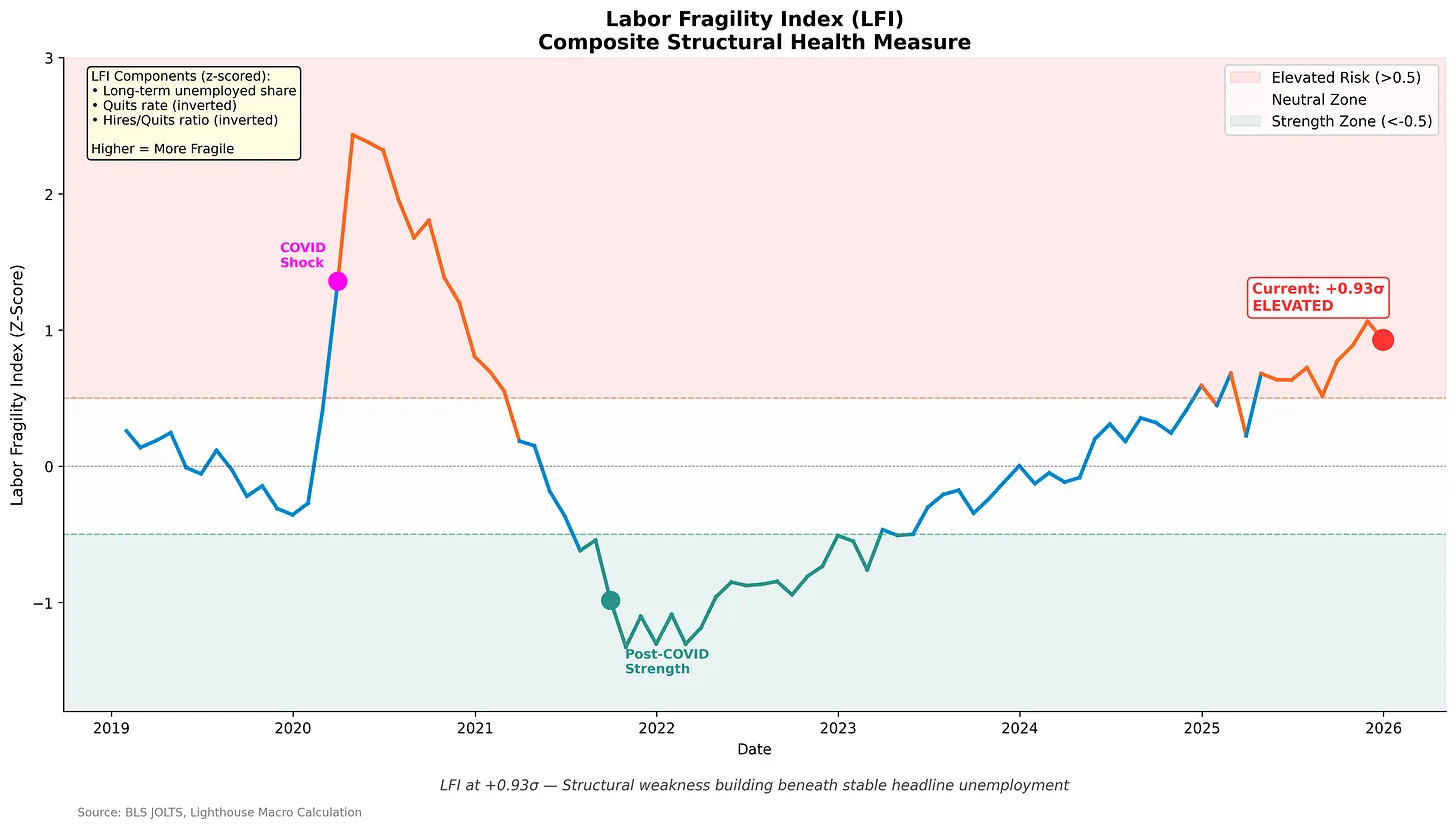
Figure 7: LFI composite at +0.93σ—structural weakness building beneath stable headline unemployment.
The LFI combines three z-scored components: long-term unemployed share, quits rate (inverted), and hires-to-quits ratio (inverted). Higher means more fragile. We’re now firmly in the elevated risk zone for the first time since the post-COVID normalization.
Perhaps more concerning: the Employment Diffusion Index has fallen below neutral for the first time since the pandemic recession.
When the diffusion index falls below 50%, it indicates that more industries are contracting employment than expanding. This is a broad-based weakness signal that typically precedes deterioration in headline unemployment by 3–6 months.
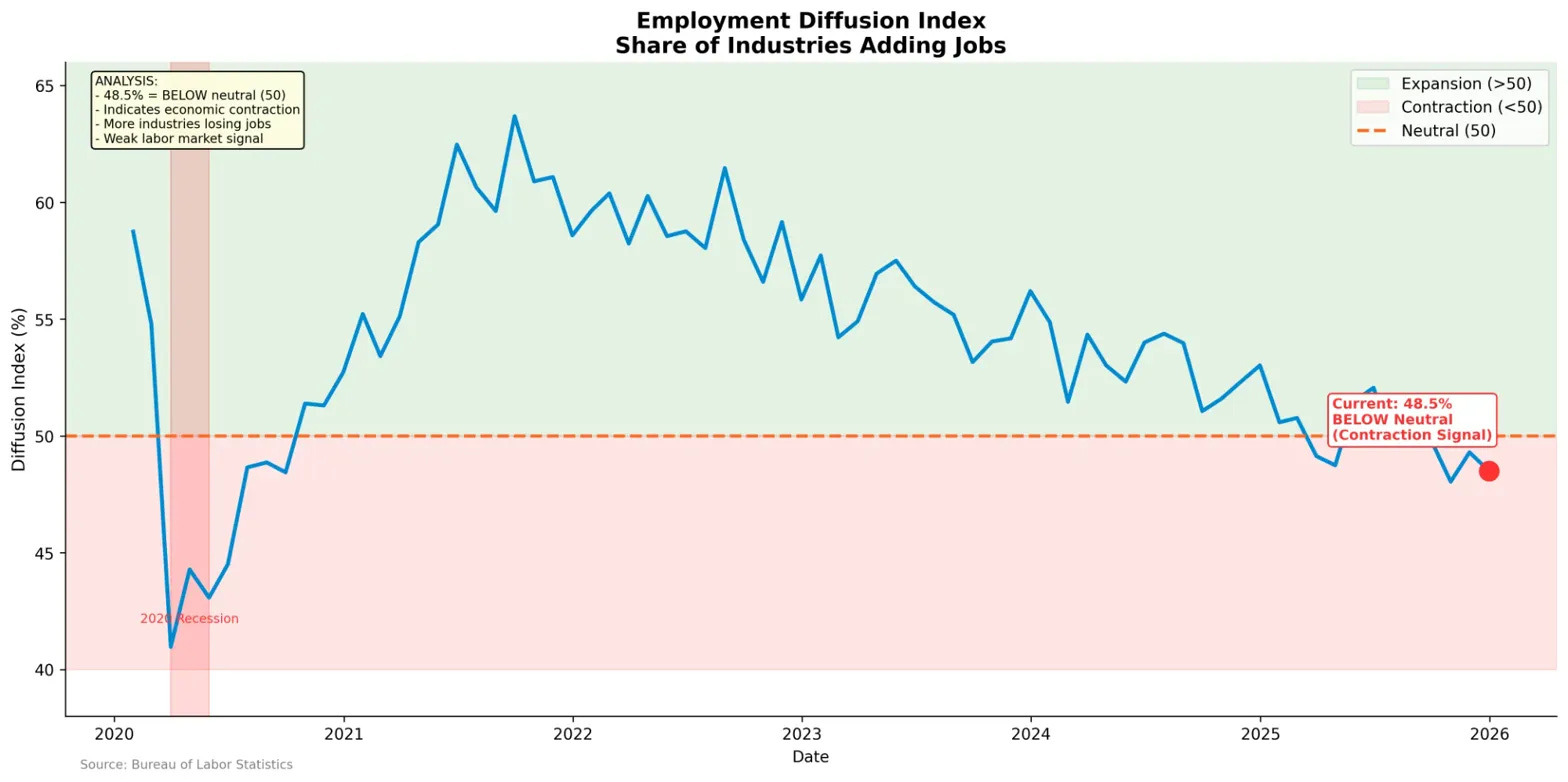
Figure 8: Employment Diffusion at 48.5%—more industries now losing jobs than adding them.
Duration Tells the Real Story
Here’s what the headline doesn’t show: the distribution of unemployment duration has shifted dramatically.
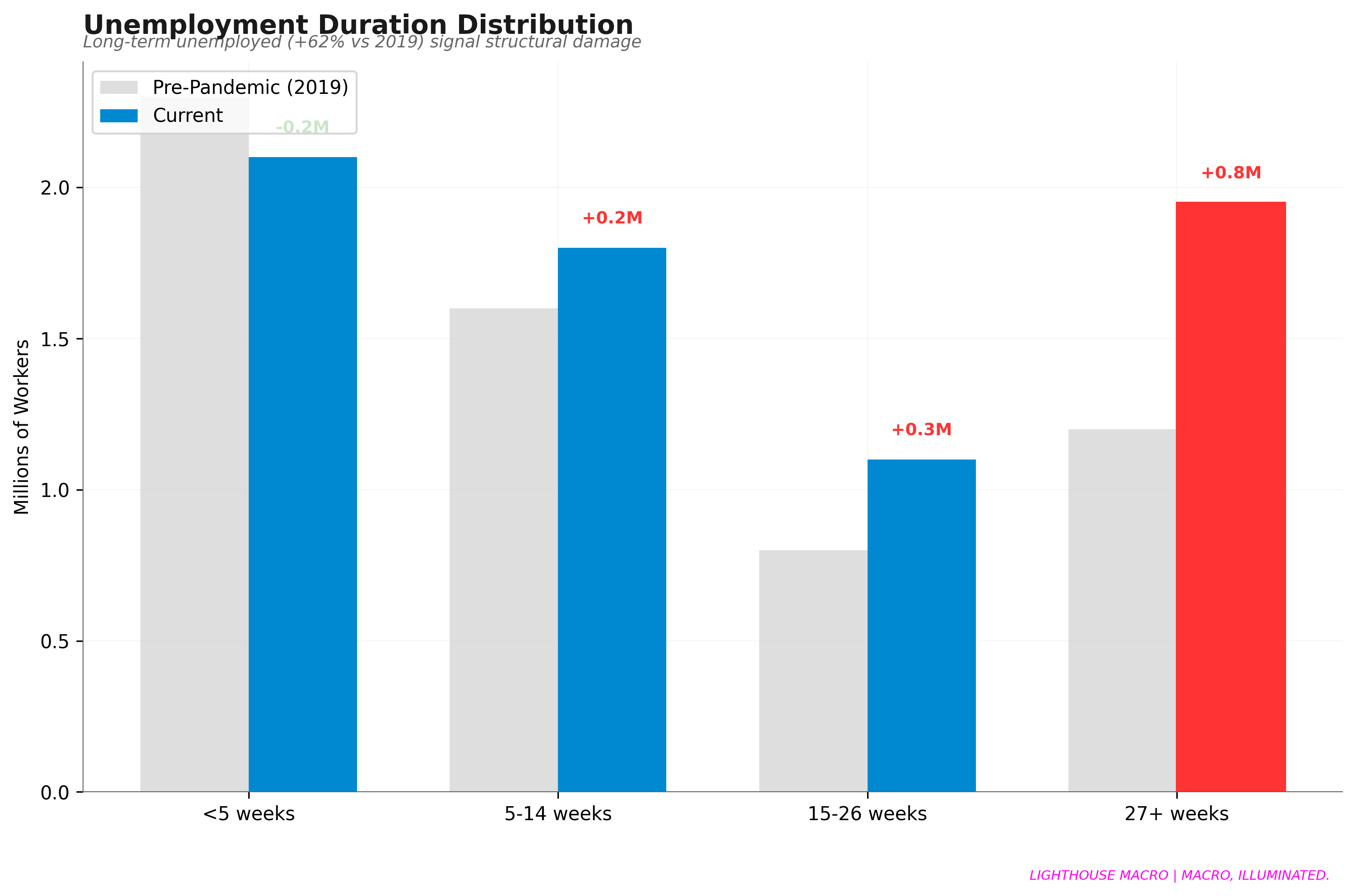
Figure 9: Duration cohorts reveal structural damage invisible in headlines.
Short-term unemployment (less than 5 weeks) has declined since the pre-pandemic period. But long-term unemployed (27+ weeks) have increased by 750,000, a 63% jump. Workers aren’t cycling through unemployment quickly. They’re getting stuck.
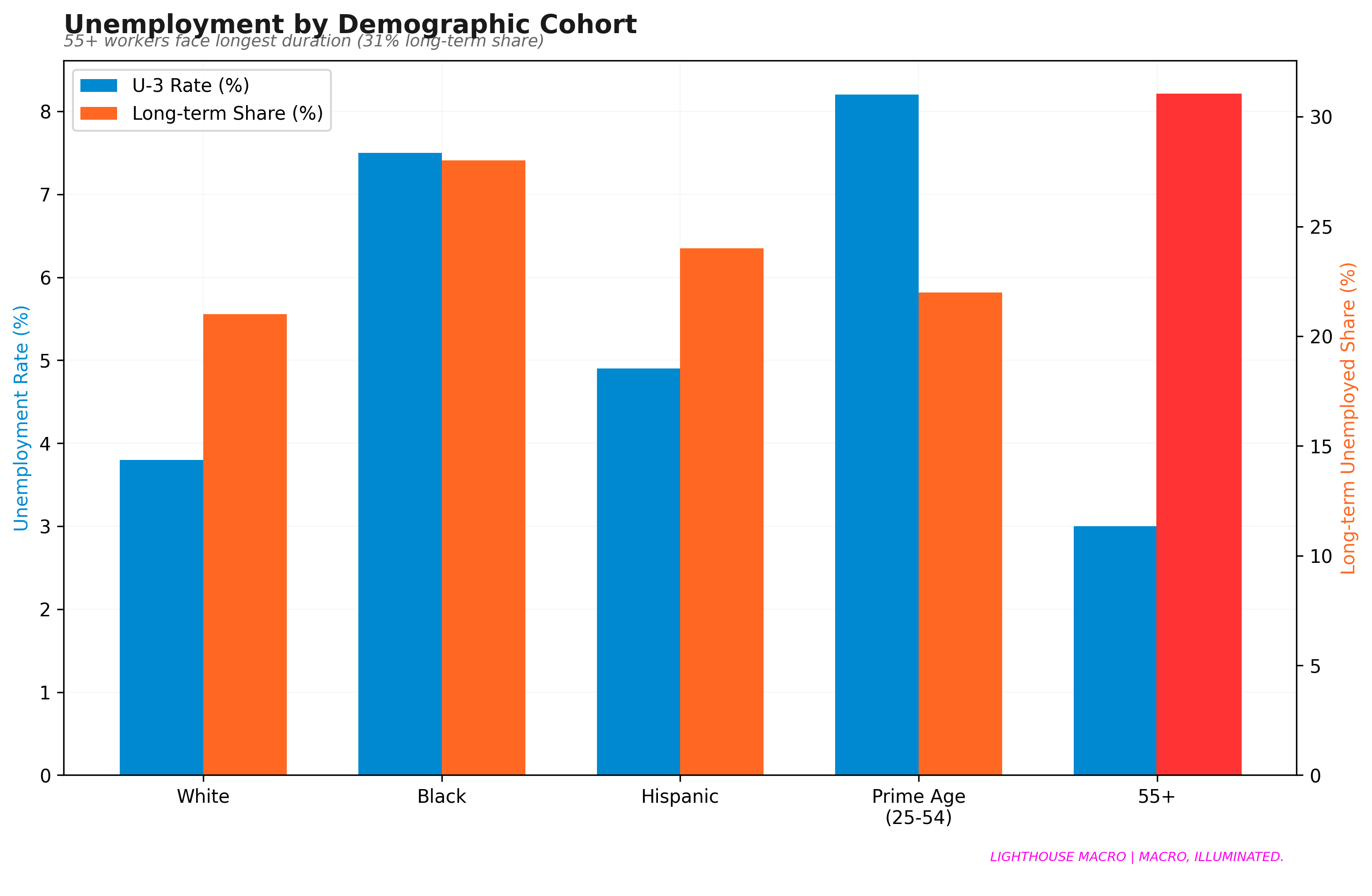
Figure 10: Demographic breakdown shows the 55+ cohort disproportionately trapped.
The K-Shaped Employer
Net job creation now comes almost entirely from large firms. Small businesses, the traditional engine of employment growth, have essentially stopped hiring.
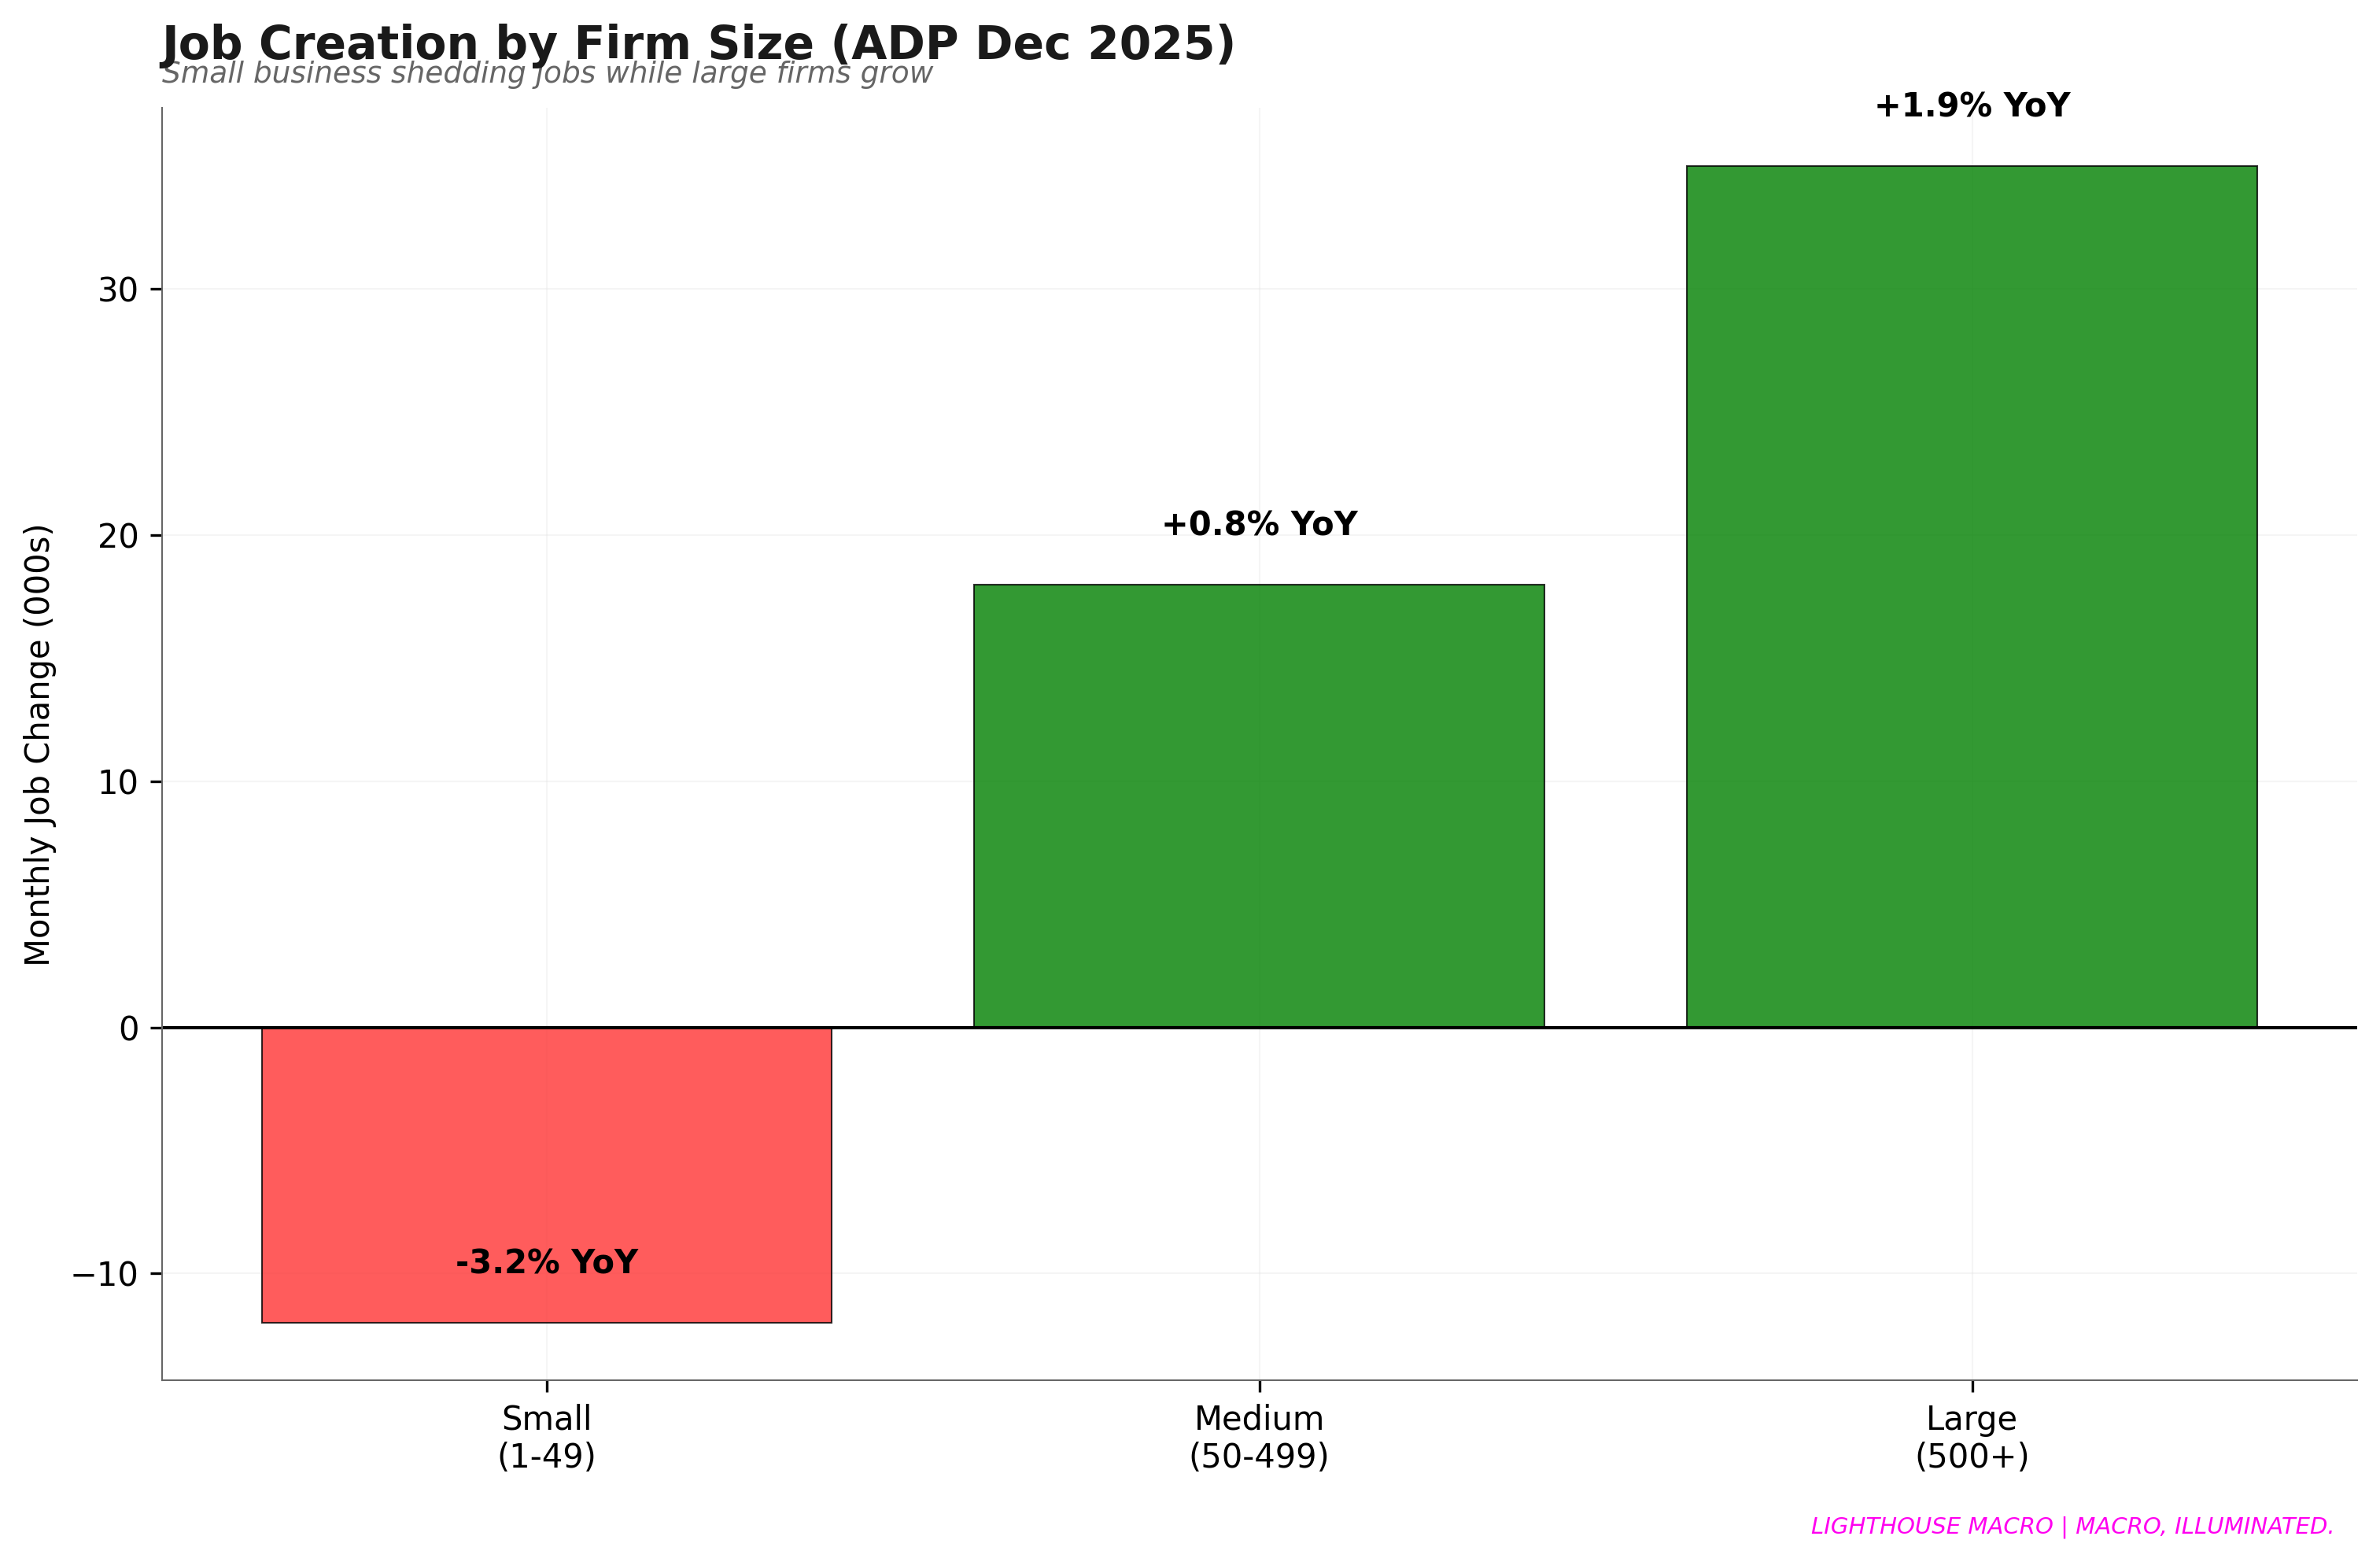
Figure 11: Net job creation divergence—small businesses shedding jobs while large firms grow.
Sector divergence is equally stark. Government (+2.2% year over year) and healthcare (+2.8% year over year) are carrying employment growth. Professional and business services (-1.6% year over year) and manufacturing (-2.5% year over year) are in outright contraction. We’re witnessing a white-collar recession disguised by public sector hiring.
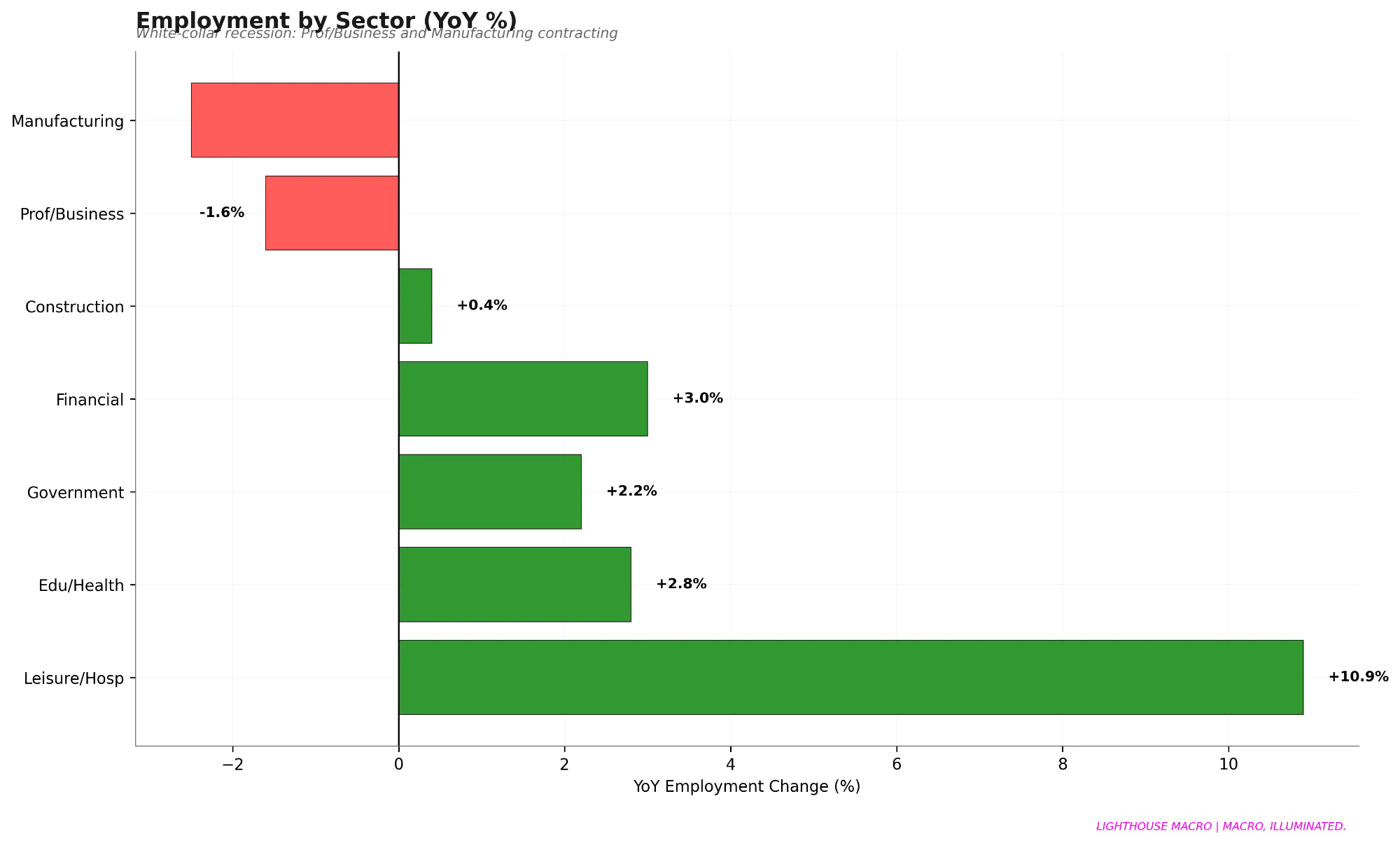
Figure 12: Sector-level employment shows stark divergence—government and healthcare carrying the load.
Part III — The Liquidity Twilight Zone
For the past two years, the Overnight Reverse Repo Facility (ON RRP) acted as the system’s shock absorber. At its peak in late 2022, it held $2.55 trillion, a massive buffer of high-quality liquid assets that could absorb Treasury supply, cushion funding stress, and provide the margin of safety that kept the plumbing functioning.
That buffer is gone.
ON RRP now stands at $3.2 billion. Not trillion. Billion. That’s a 99.9% drawdown from peak. The system’s margin of error has evaporated.
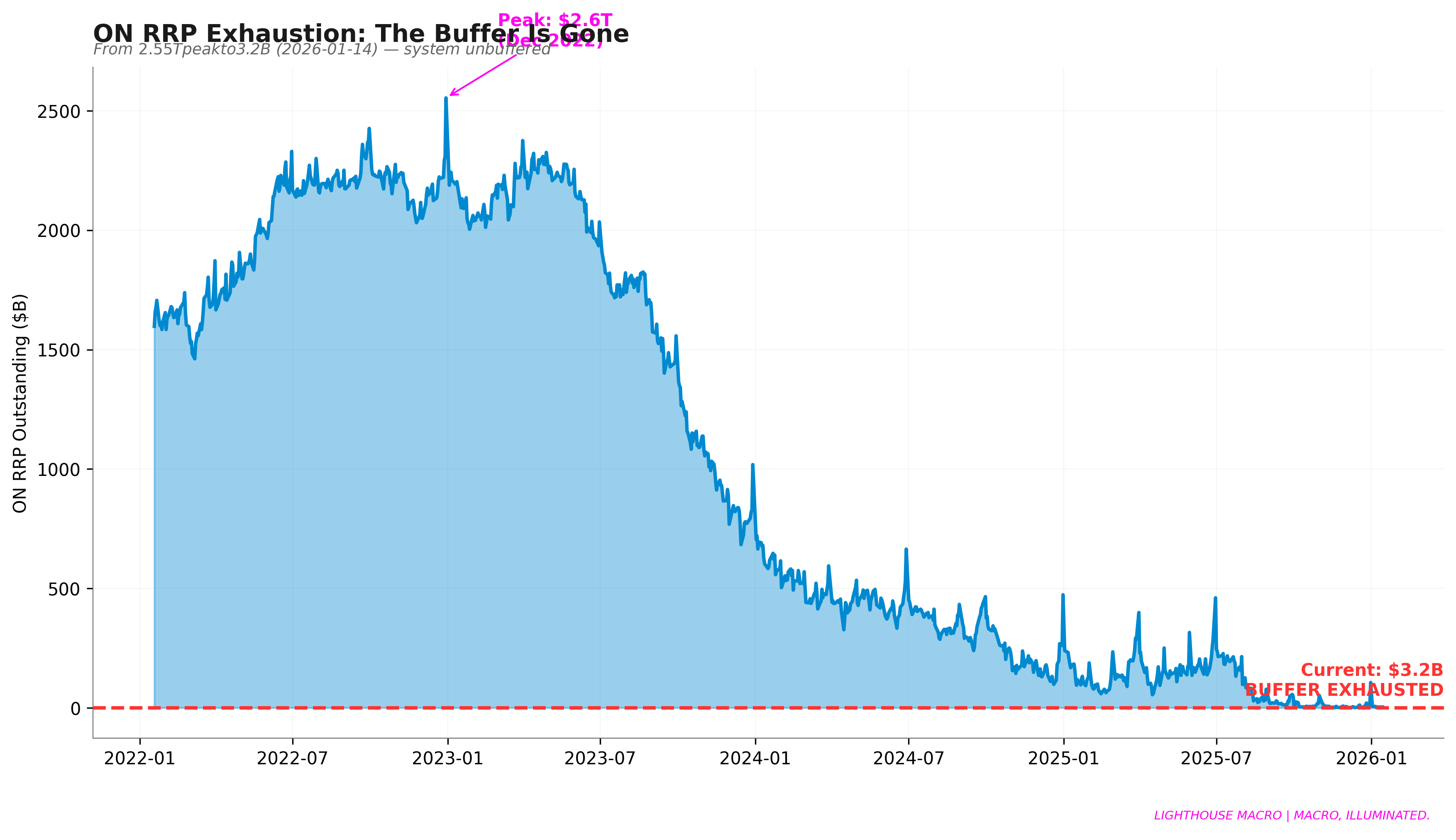
Figure 13: ON RRP exhaustion—from $2.55T to $3.2B. The buffer is gone.
Bank Reserves: Approaching the Floor
Bank reserves sit at $2.88 trillion, approaching what I call the Lowest Comfortable Level of Reserves (LCLOR), estimated around $2.8 trillion. Below that level, funding stress historically emerges: repo rates spike, dealer balance sheets tighten, and funding markets become nonlinear. The transmission mechanism from monetary policy to markets becomes unpredictable.
The Fed has initiated reserve management purchases (~$40B/month) to slow the decline, but at current pace this barely offsets ongoing structural drains from currency demand and TGA fluctuations. It’s a technical fix, not a buffer rebuild.
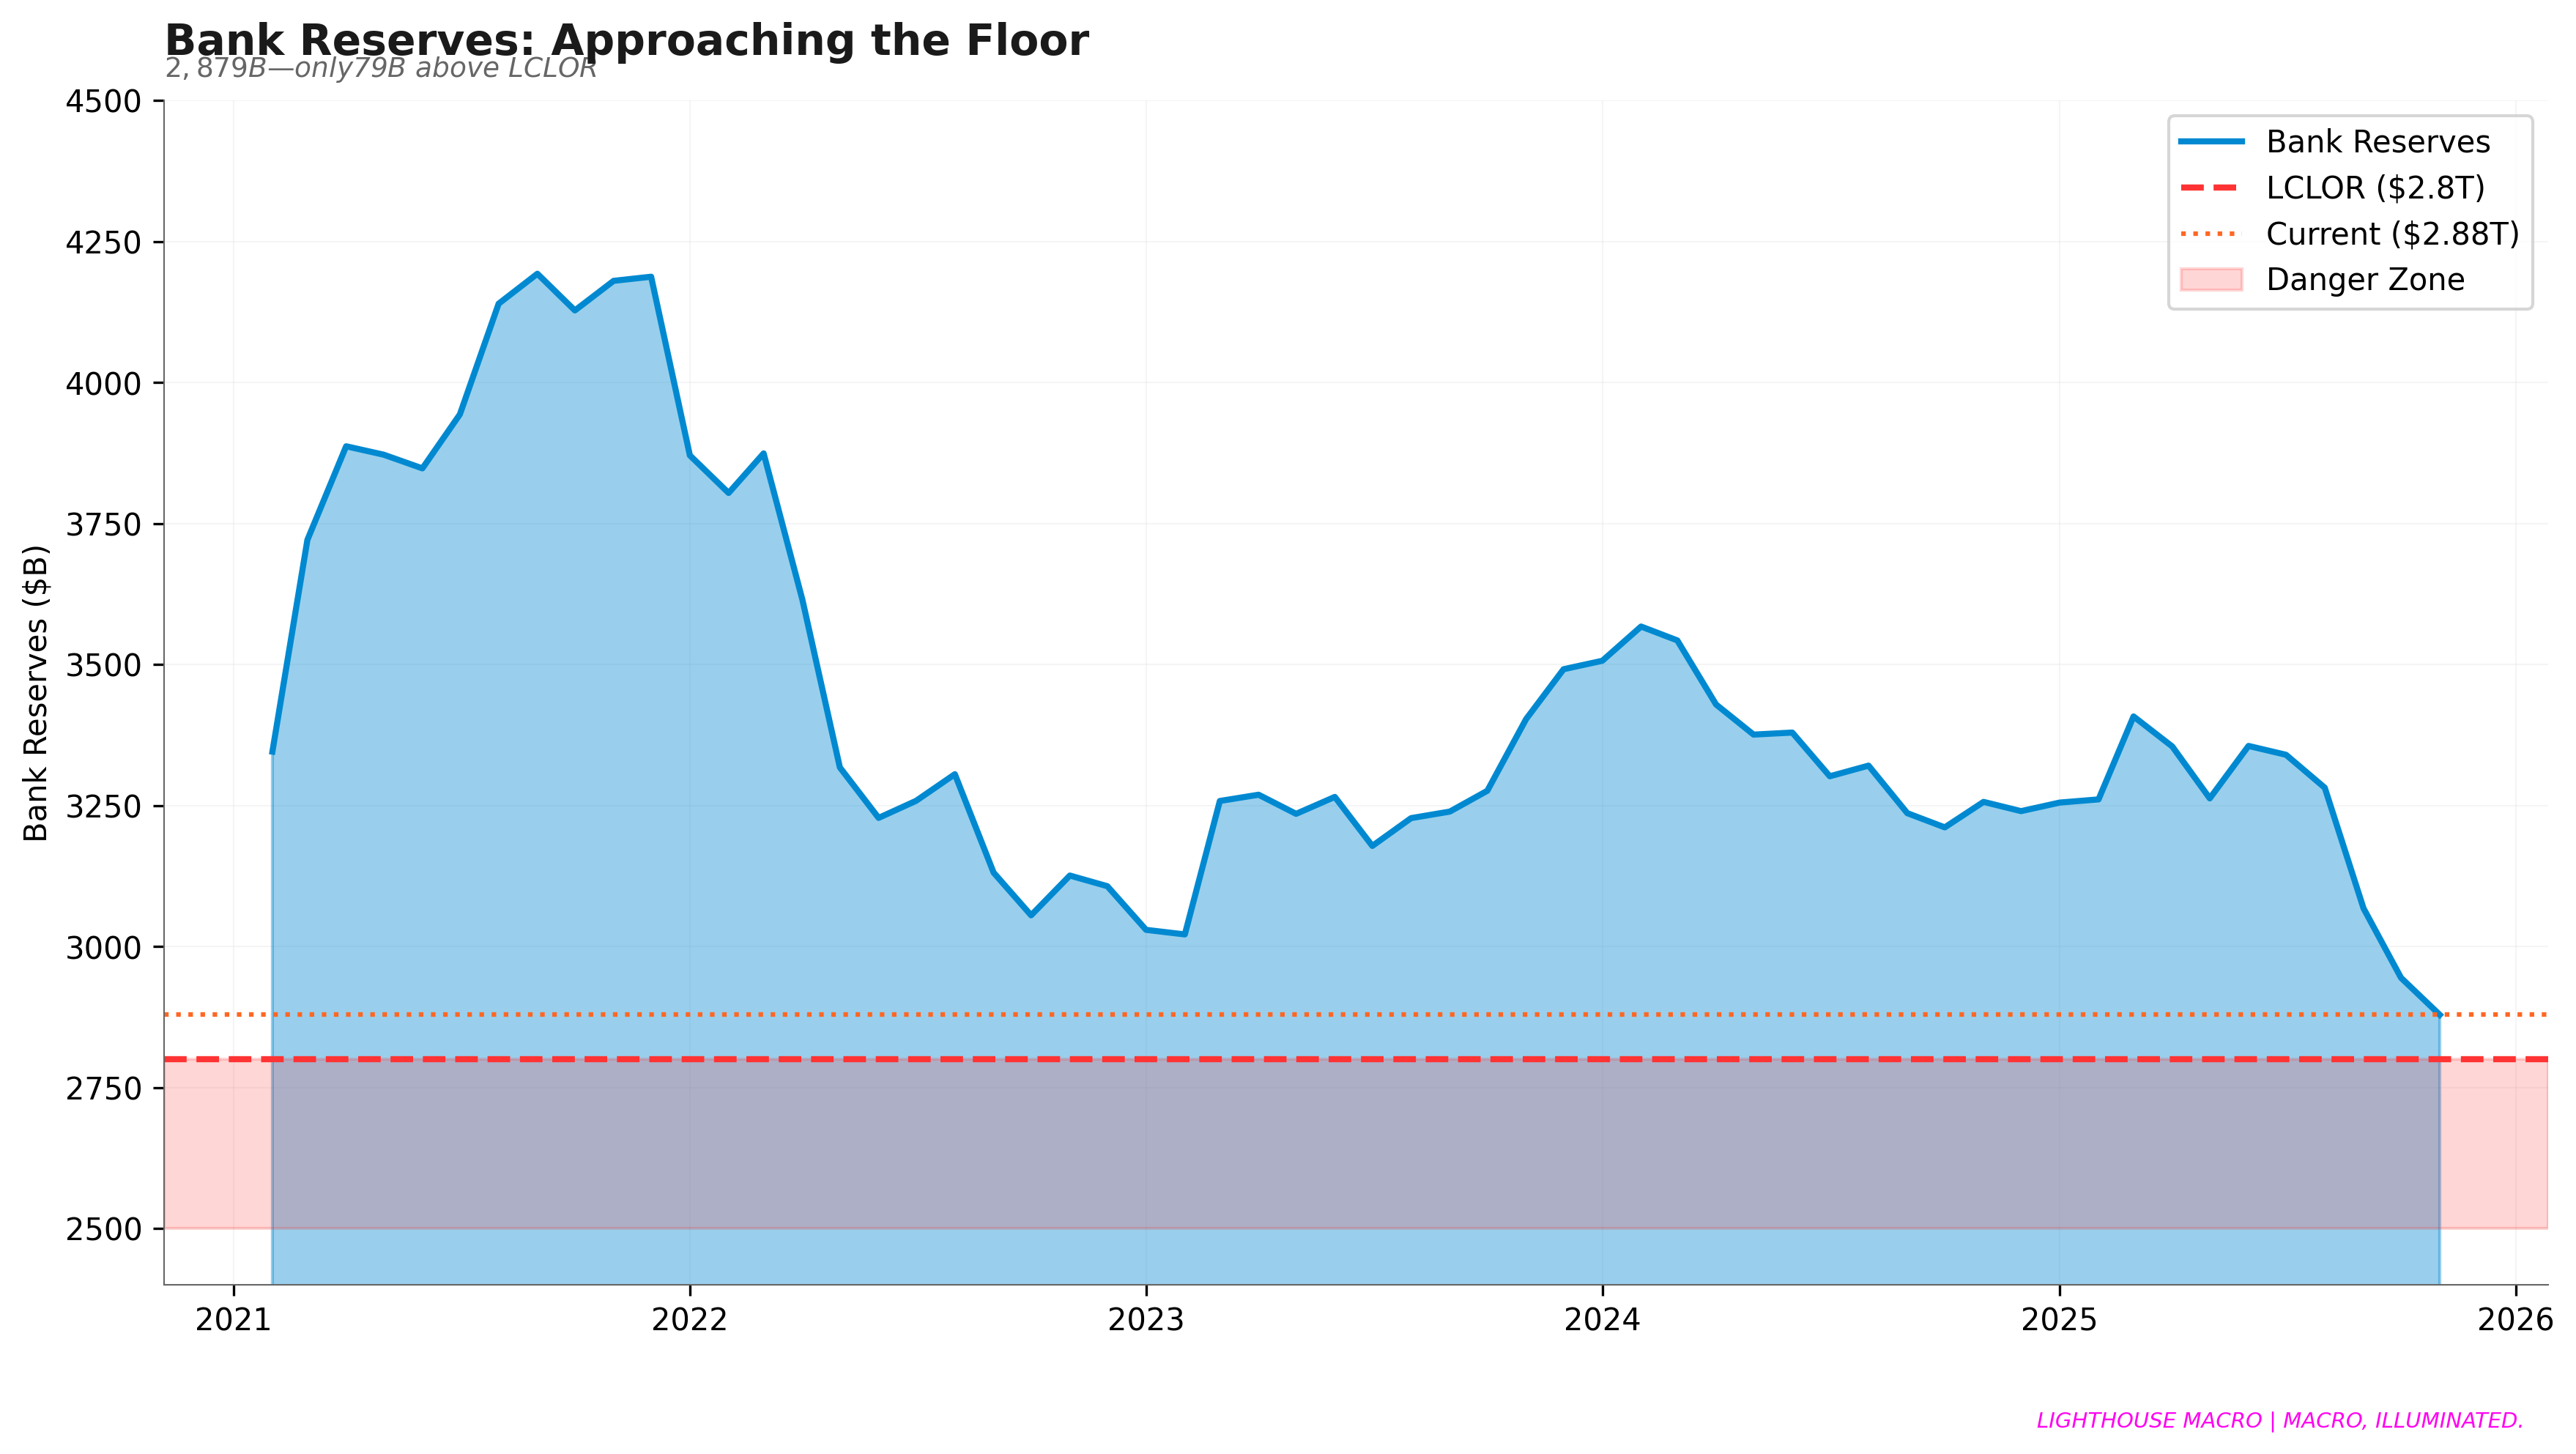
Figure 14: Bank reserves approaching the LCLOR danger zone—only $79B of buffer remaining.
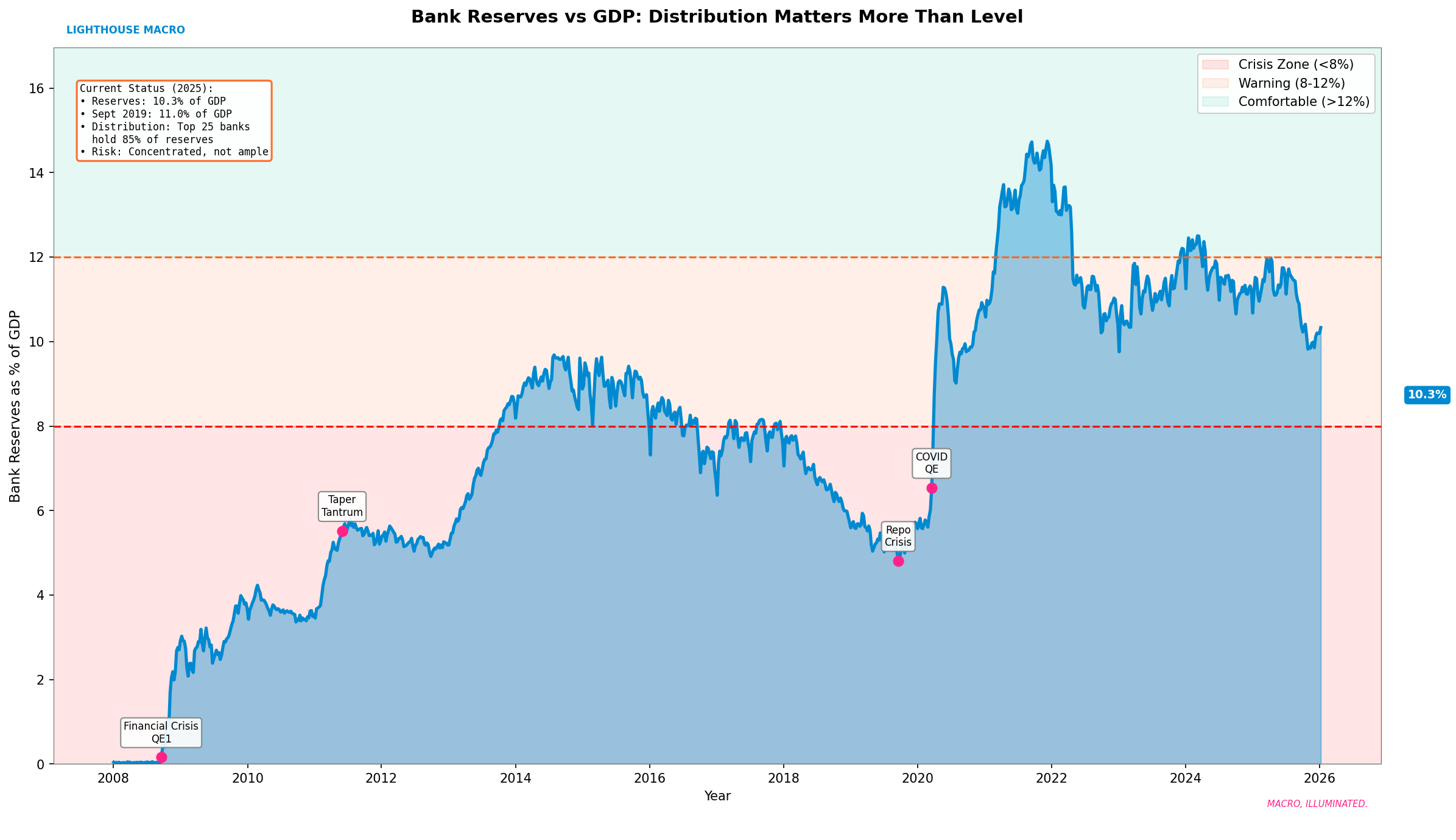
Figure 15: Bank reserves as % of GDP with historical context—distribution matters more than level.
Funding Spreads: Calm Before the Storm
The SOFR–EFFR spread currently stands at approximately 1 basis point. It’s the calm of a system running without buffers. When stress arrives, via Treasury supply, tax payments, or quarter-end pressures, there’s nothing left to absorb it.
Historically, sustained SOFR–EFFR dislocations exceeding 15–20 basis points have reflected dealer balance-sheet constraints, often coinciding with reserve scarcity or Treasury settlement stress.
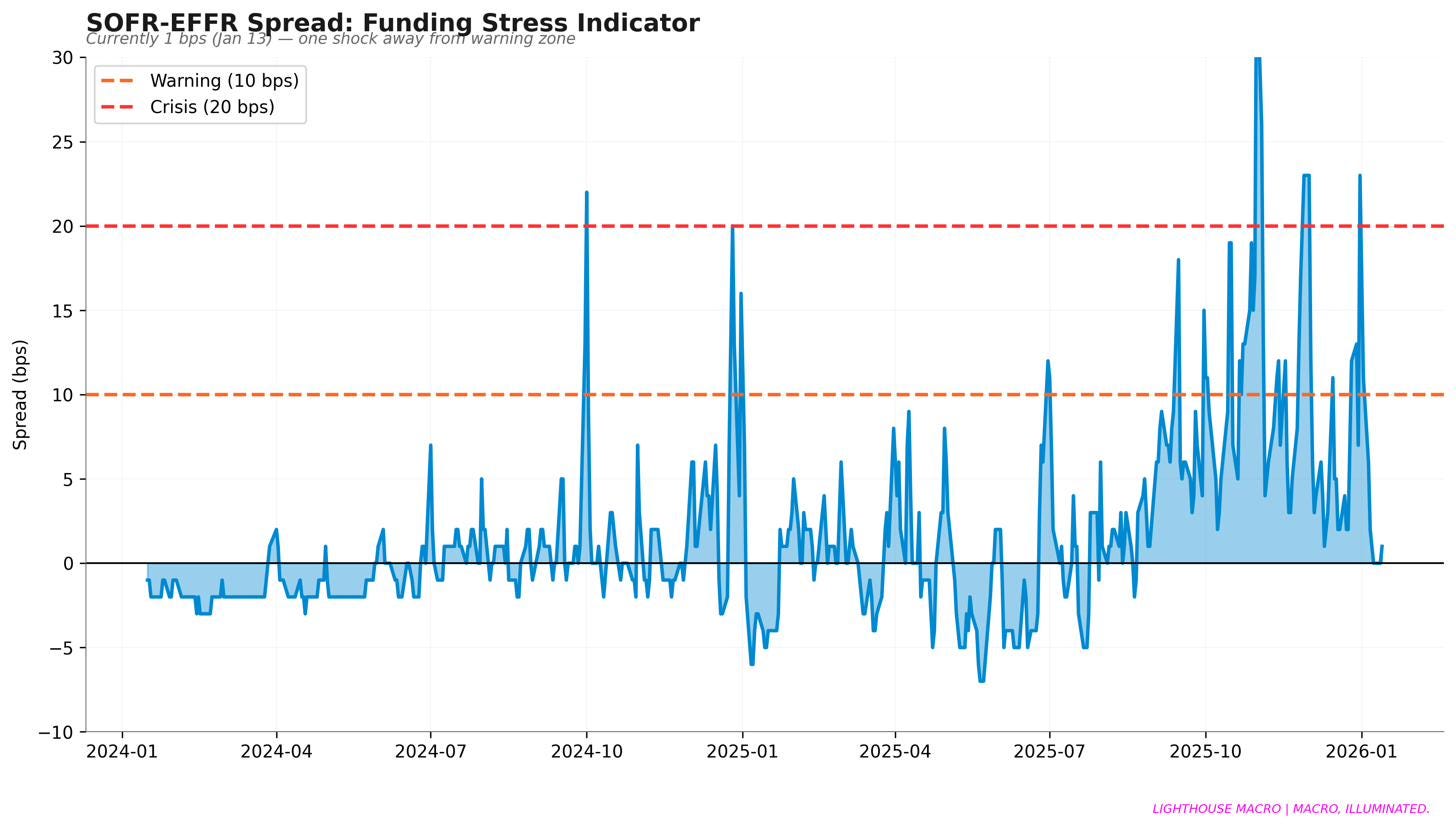
Figure 16: SOFR-EFFR spread—calm surface, fragile foundation.
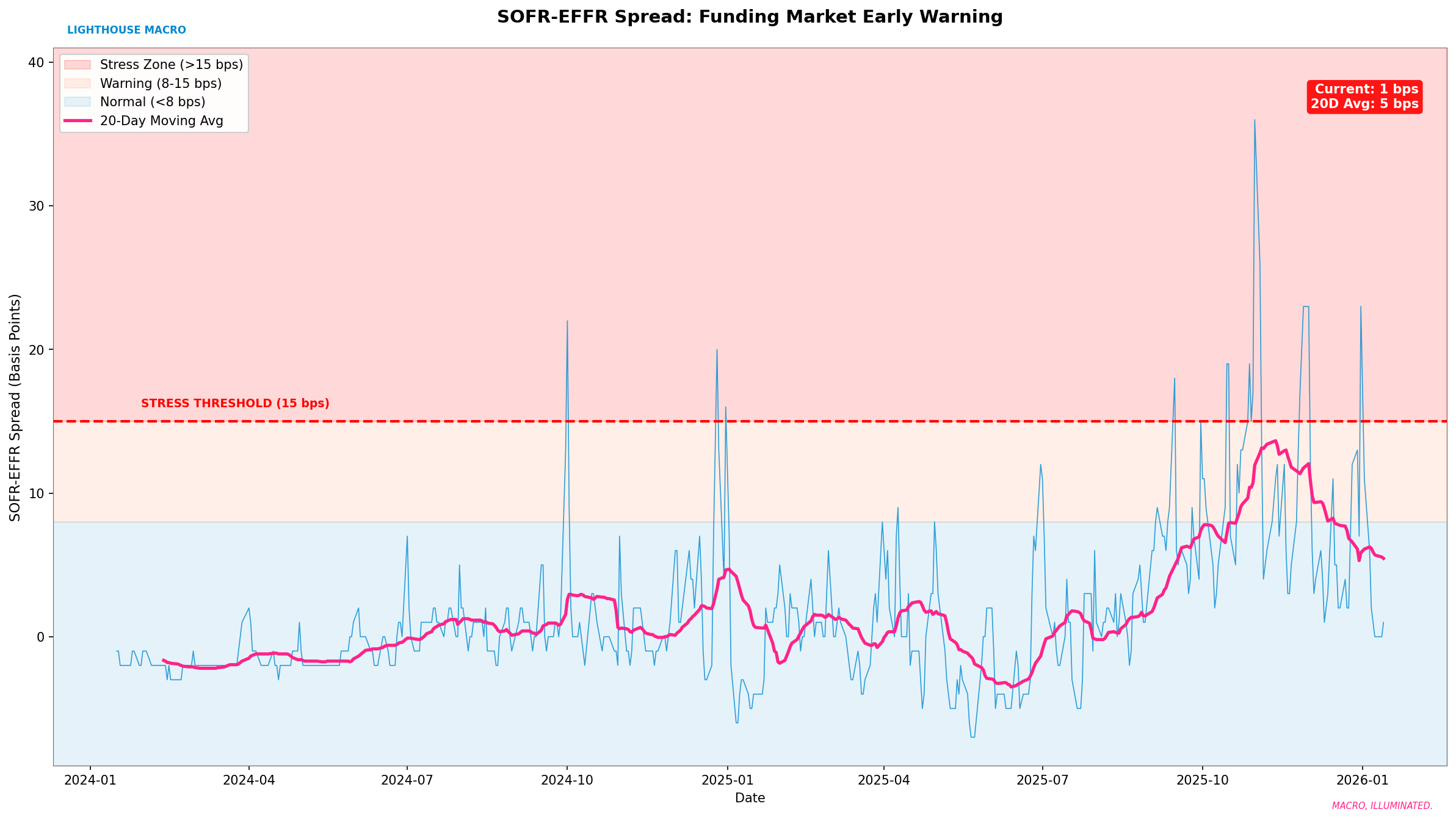
Figure 17: Historical stress zone analysis for funding spreads.
Part IV — The Consumer Bifurcation
The American consumer isn’t a monolith. It’s two entirely different economies operating side by side.
The top 20% of households still hold roughly $480 billion in excess savings from pandemic stimulus. They’re buffered. Their balance sheets are intact. Asset appreciation has more than offset inflation erosion.
The bottom 80%? They’re in deficit. Excess savings exhausted. Credit cards maxed. Running on fumes.
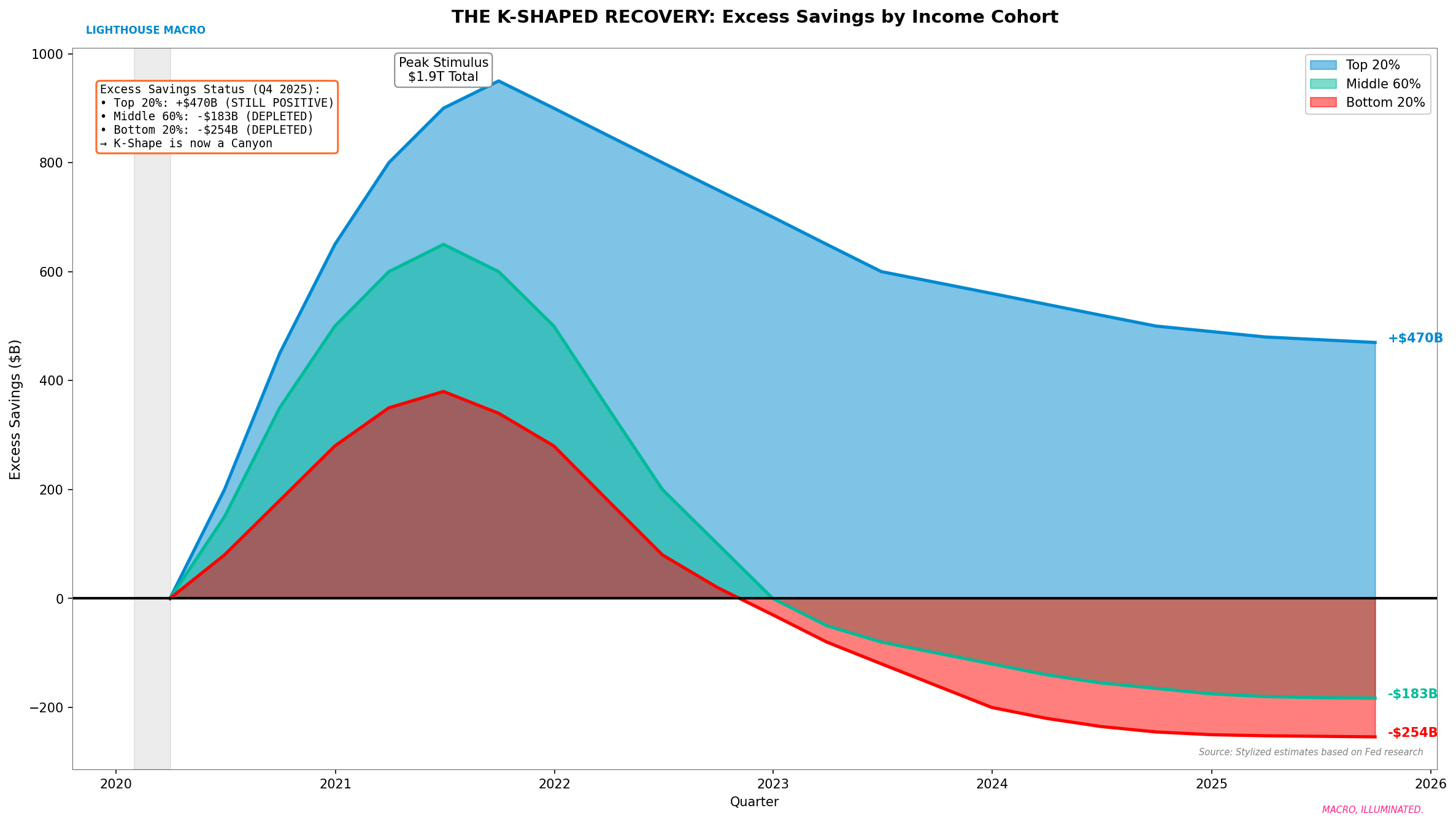
Figure 18: Excess savings by income cohort—bottom 80% in deficit territory.
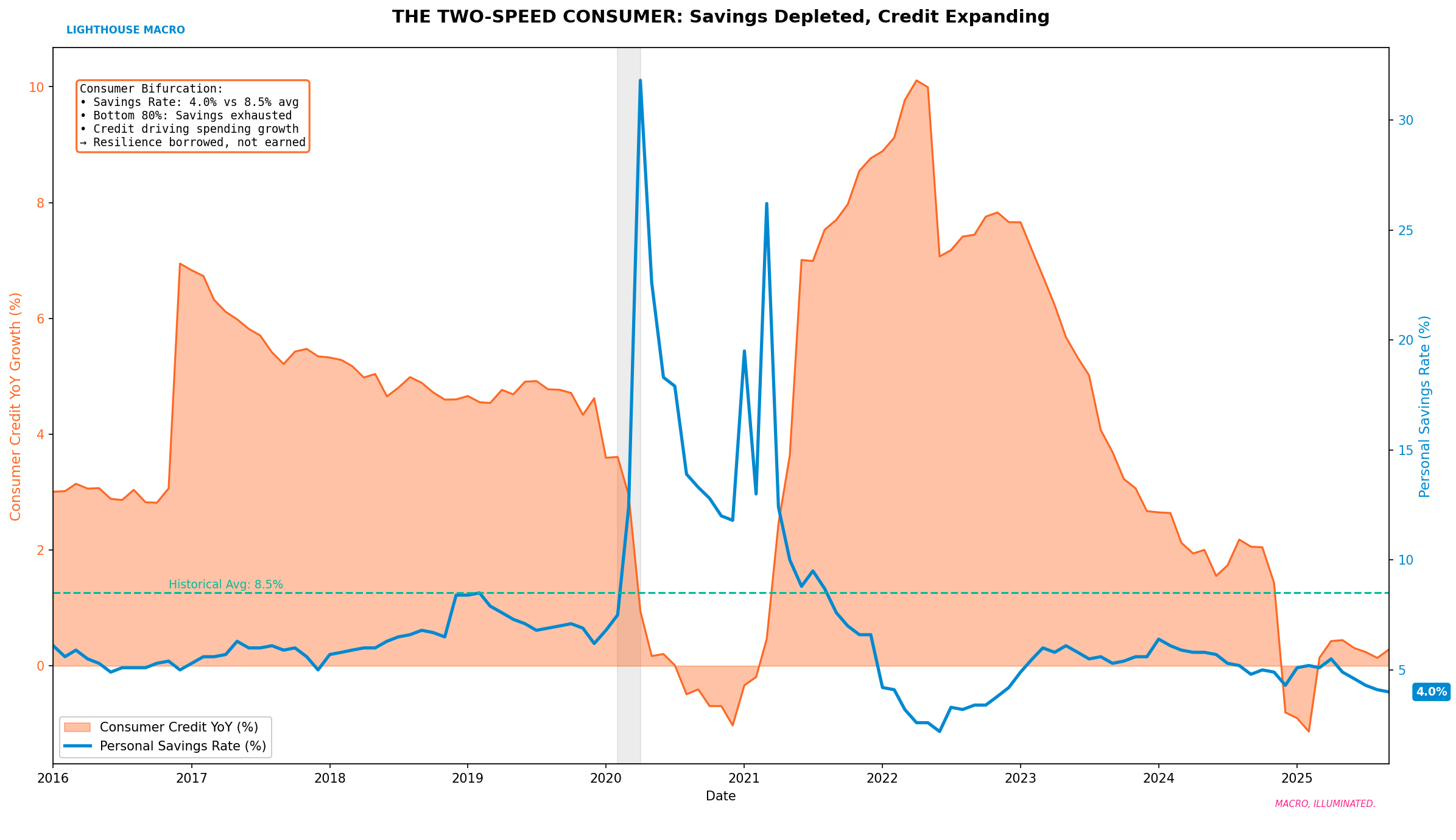
Figure 19: The K-shaped consumer—savings depleted, credit expanding.
Delinquencies: The Leading Indicator
Credit stress always shows up first at the margins. And the margins are screaming.
Subprime auto delinquencies have reached levels last seen during the 2008-2009 crisis. Credit card delinquencies are tracking toward multi-decade highs. This is not 2008, the banking system is far better capitalized, but it is clear evidence that consumer bifurcation has reached a late-cycle breaking point.
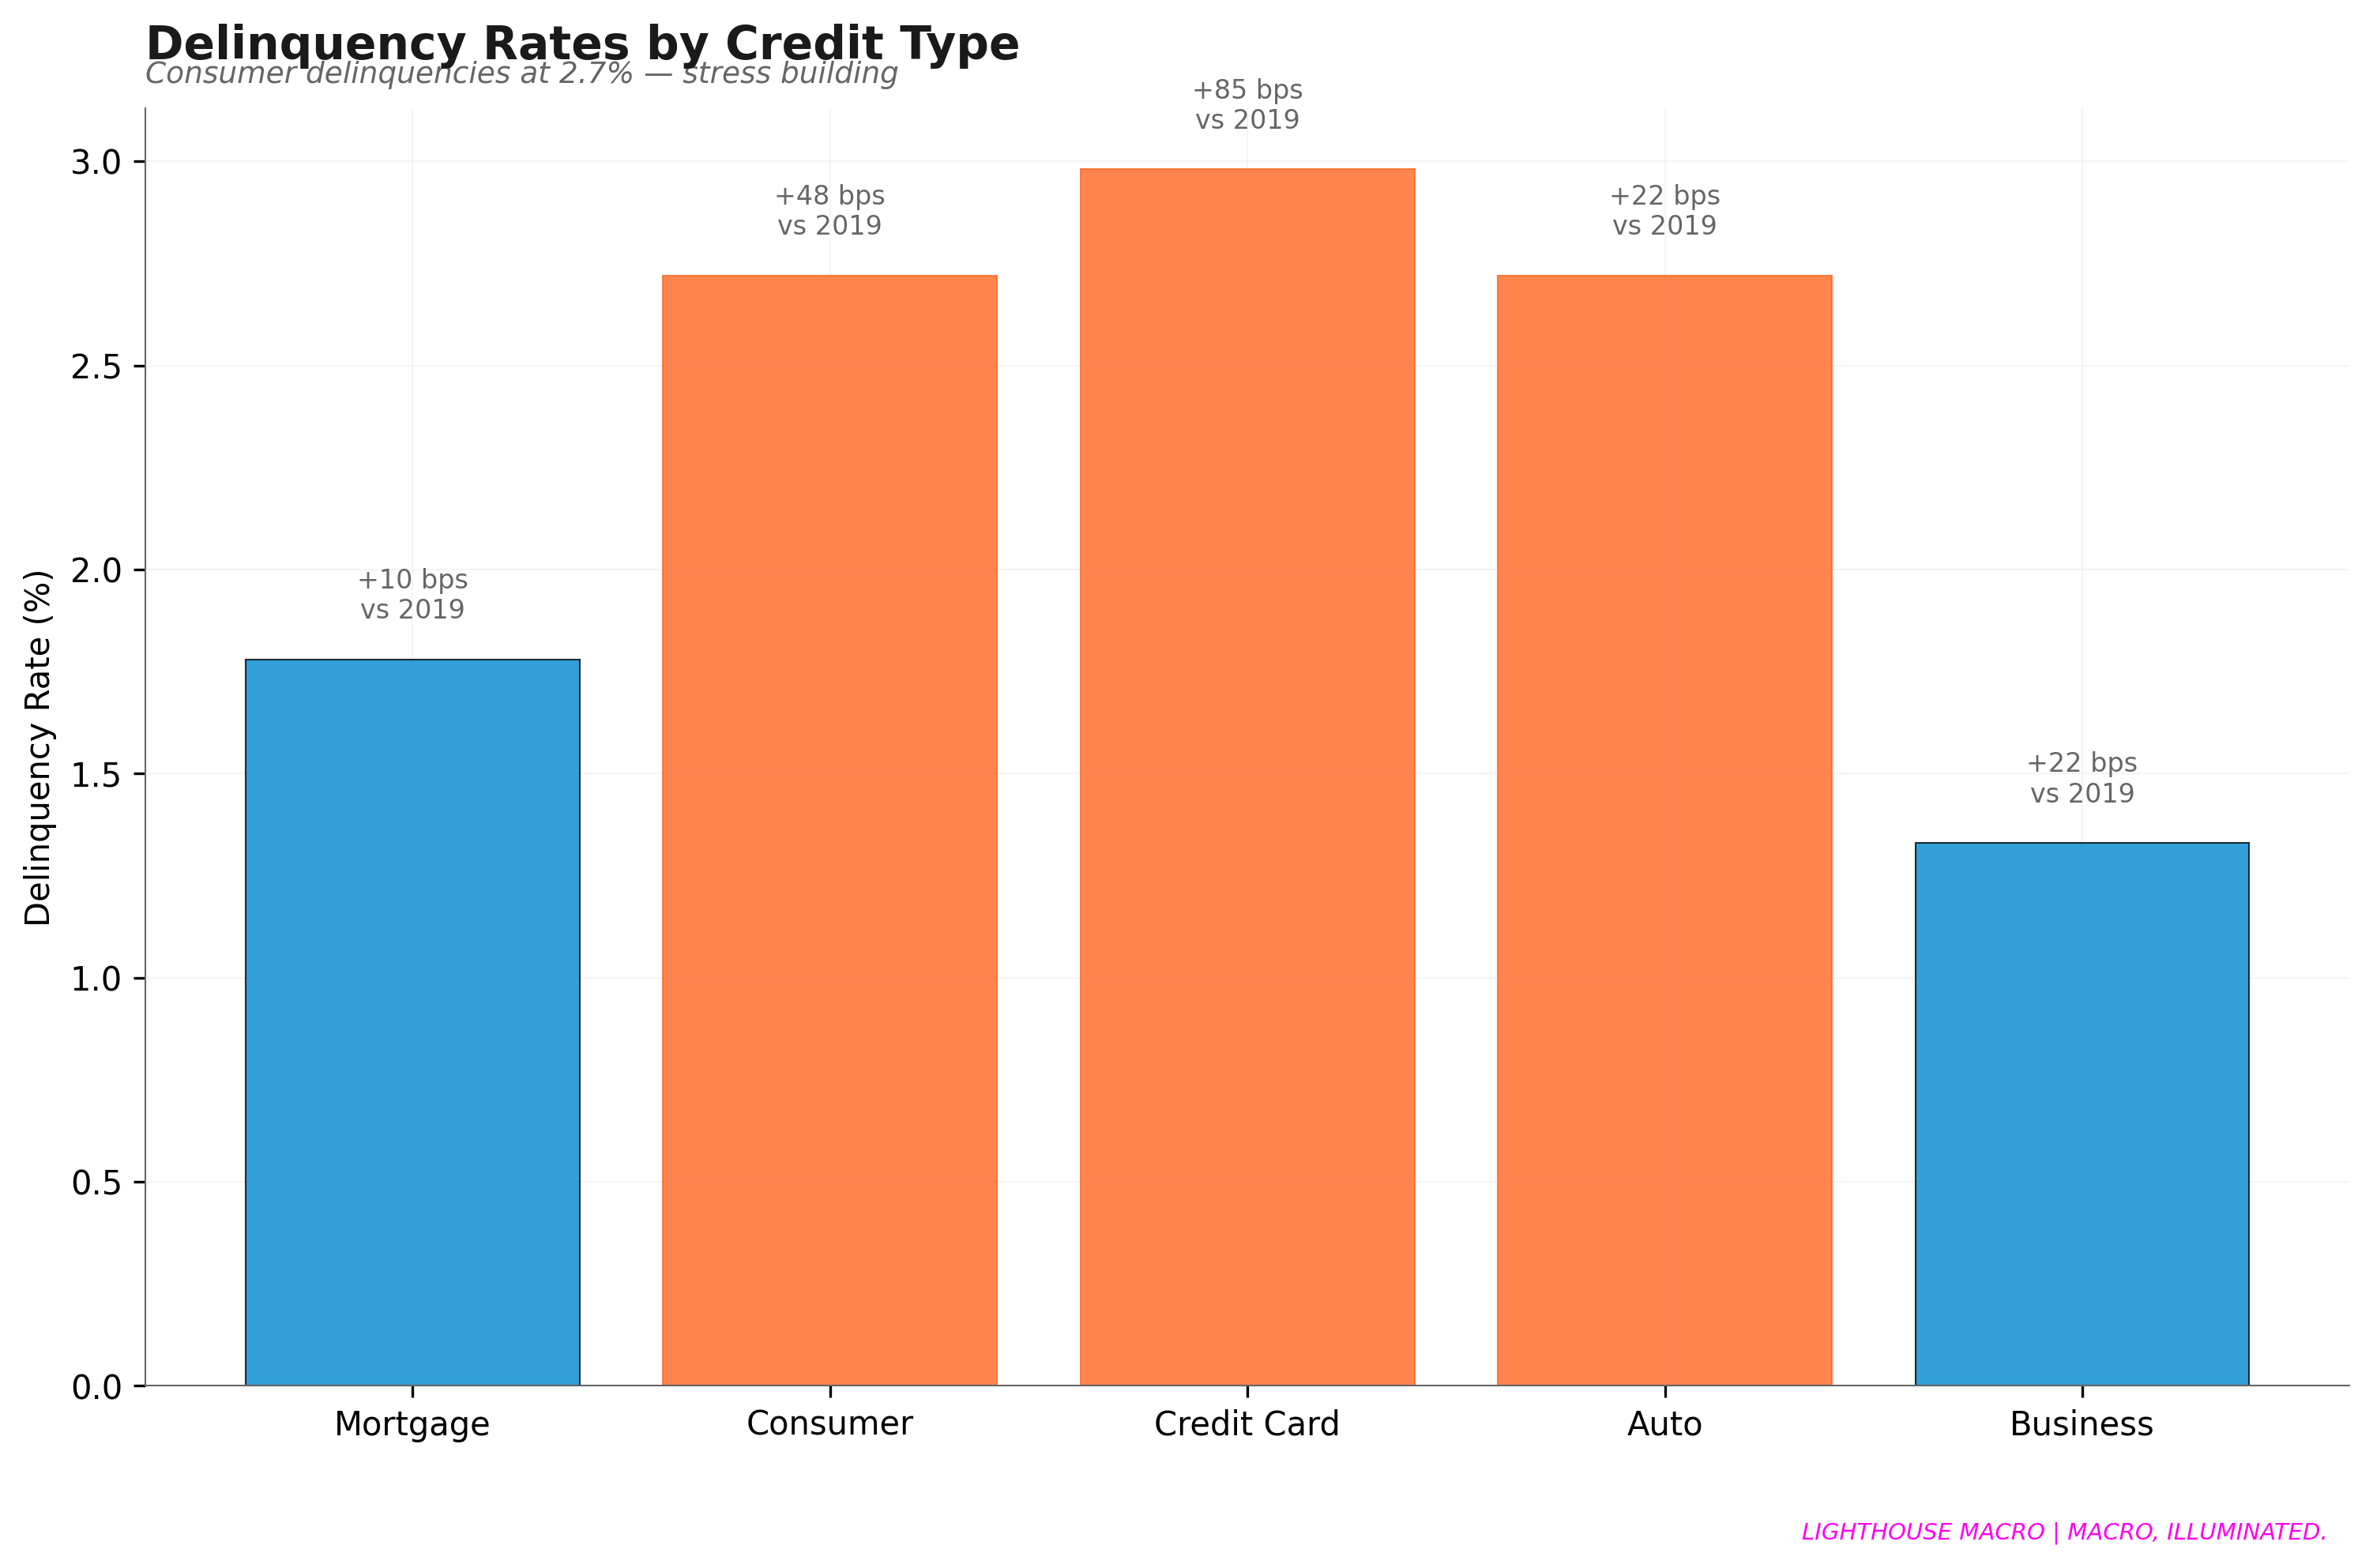
Figure 20: Consumer delinquency rates by category—credit card and auto stress elevated.
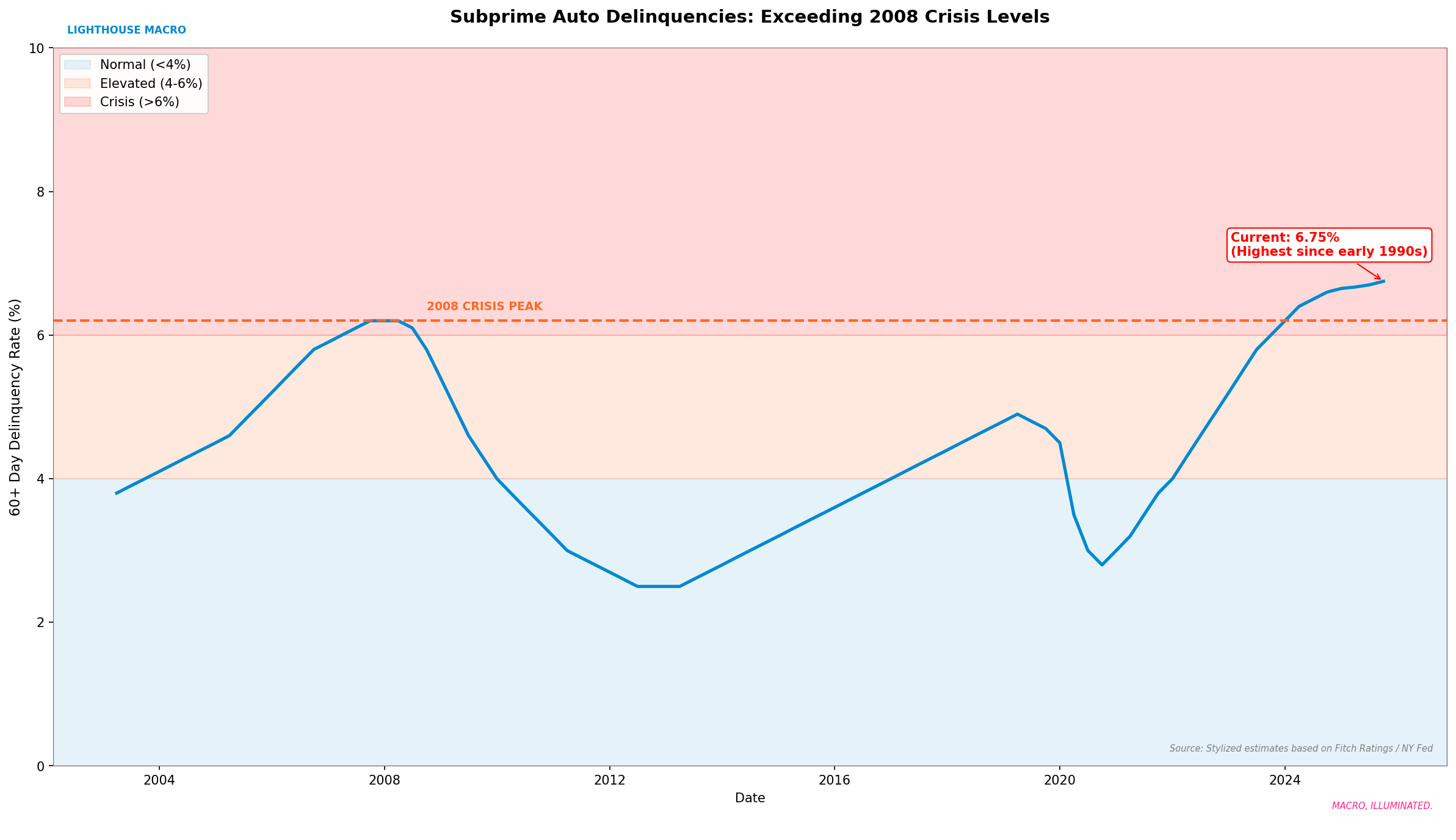
Figure 21: Subprime auto delinquencies at crisis levels—all metrics exceed 2008.
Part V — Credit Complacency
Perhaps nowhere is the disconnect more stark than in credit markets.
High-yield OAS sits at 274 basis points, the 2nd percentile since 2000. Investment-grade spreads are similarly compressed across the quality spectrum. Credit markets are pricing in perfection.
Here’s the problem: credit markets are ignoring what the labor market is telling us. Our Credit–Labor Gap (CLG) indicator reads -1.2, indicating that credit spreads are materially tighter than labor fundamentals would historically justify. That means spreads are too tight relative to the structural weakness in employment. History suggests this gap will close, typically with credit widening to reflect reality.
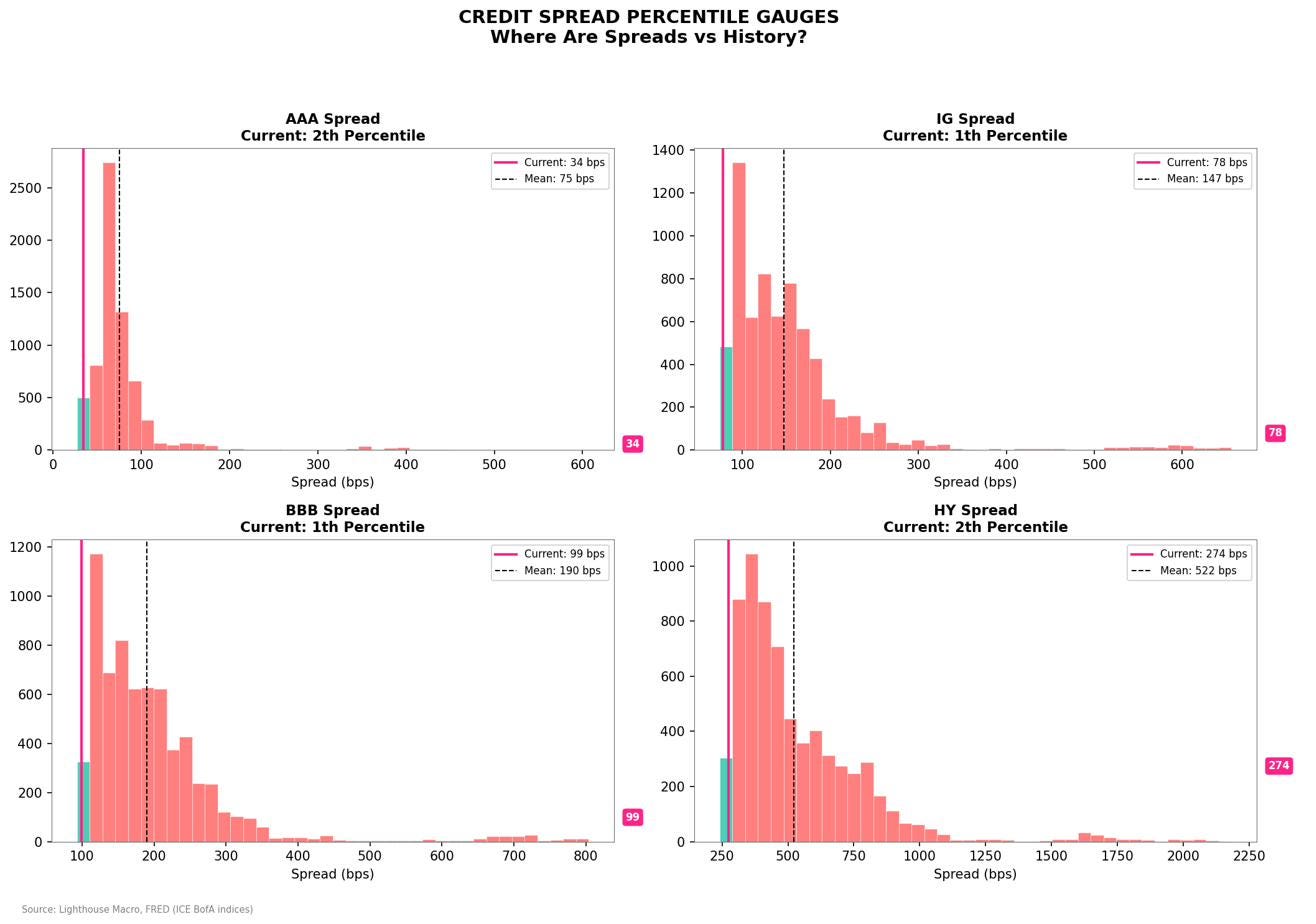
Figure 22: Credit spreads at historical tight extremes—all tiers in bottom quintile.
Part VI — What Comes Next
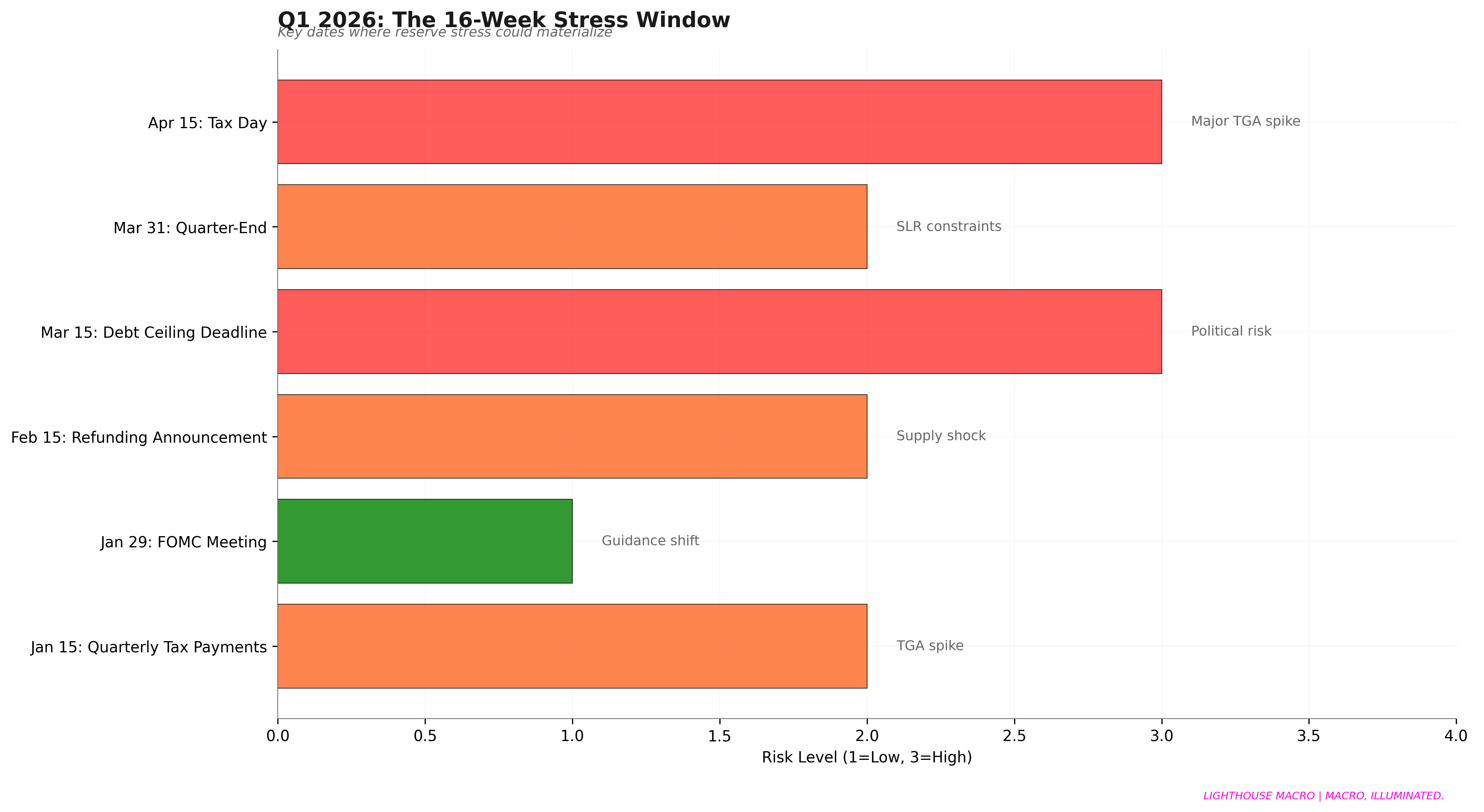
Figure 23: Q1-Q2 2026 stress event calendar.
The first half of 2026 presents a gauntlet of stress points:
January 15: Debt ceiling reinstated
March 15: Corporate tax deadline drains reserves
April 15: Individual tax deadline maximizes TGA
May 1: Quarterly refunding floods duration into a market with no buffer
Each event individually is manageable. But sequentially, with no RRP cushion and reserves at LCLOR, the margin for error is razor-thin.
Scenario Probabilities
Hollow Rally Continues (35%): Status quo maintained through Q1
Controlled Repricing (25%): Auction tails > 5 bps, SRF usage > $30B, orderly adjustment
Disorderly Unwind (20%): SOFR-EFFR > 20 bps, 10Y > 5.5%, VIX spike
Soft Landing (20%): Quits stabilize > 2.3%, claims hold < 250K
These scenarios are not mutually exclusive and may occur sequentially rather than discretely.
The Bottom Line
We are not calling for an imminent recession. We are documenting a structural shift in the system’s resilience. The Hollow Rally may continue for weeks or months. But the foundation has changed.
This framework would be invalidated by a sustained rebound in labor churn (quits >2.3%), stabilization or expansion in bank reserves, and evidence that private income growth is re-accelerating rather than being credit-substituted.
What we know with high confidence: the economy has stalled beneath headline strength. The liquidity buffer is gone. Credit markets are ignoring labor fragility. And the system is prone to discontinuity—not gradual adjustment—when stress arrives.
Position defensively. Maintain liquidity for rebalancing opportunities. Accept underperformance versus momentum-driven indices. The first half of 2026 will test the narrative of soft landing against the reality of depleted buffers.
The Hollow Rally is real. Its expiration date is unknowable. But the fundamentals that will end it are already in place.
That’s our view from the Watch. Until next time, we’ll be sure to keep the light on....
Bob Sheehan, CFA, CMT
Founder & Chief Investment Officer
Lighthouse Macro | LighthouseMacro.com | @LHMacro
MACRO, ILLUMINATED.
© 2026 Lighthouse Macro. All rights reserved. This report is for informational purposes only and does not constitute investment advice.